- GBP/USD is approaching the 1.2500 figure and the last swing high.
- The level to beat for bulls is the 1.2500 level.
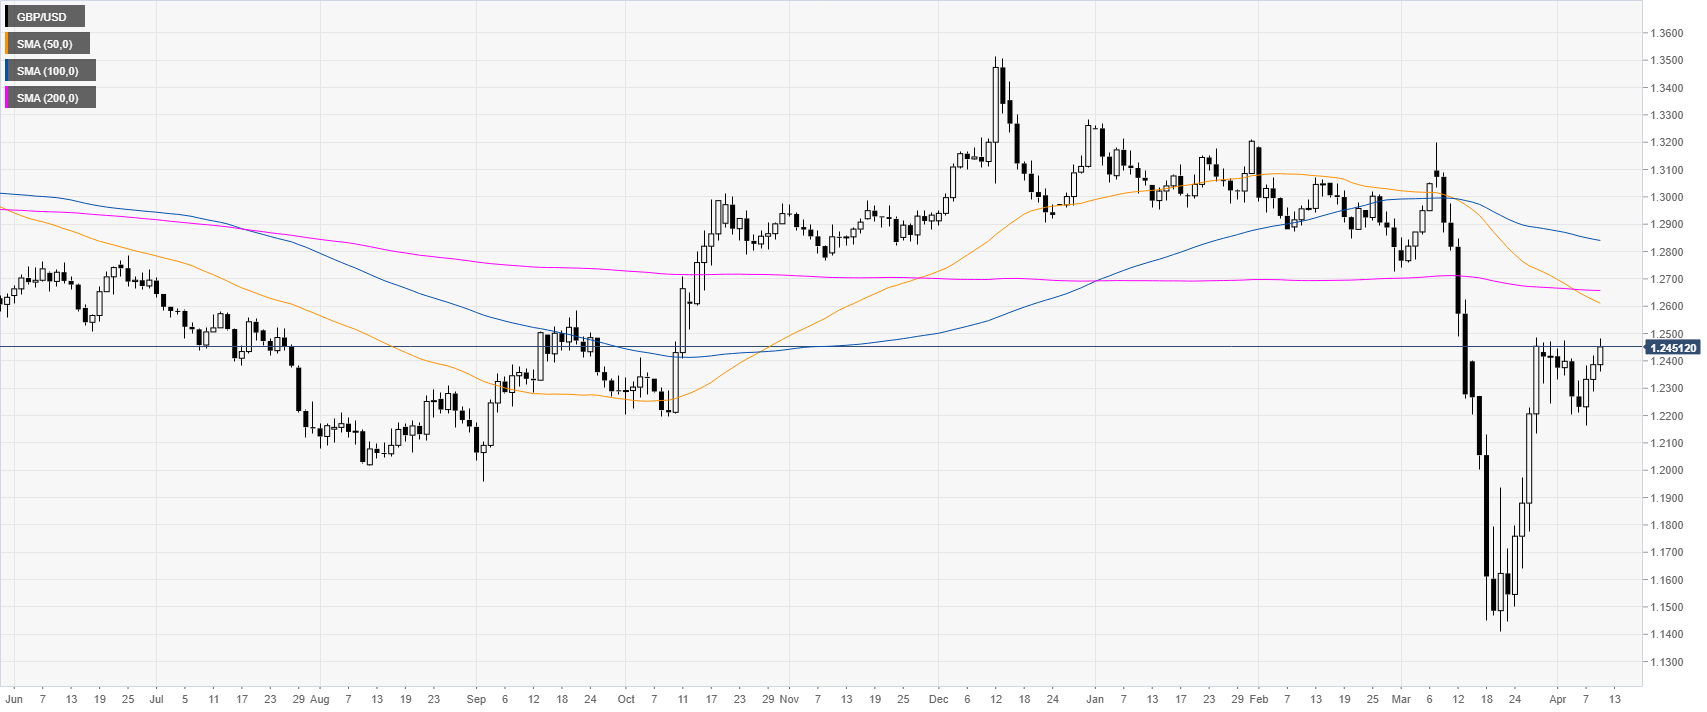
GBP/USD daily chart
After tumbling to 1985 lows in March, GBP/USD is rebounding sharply while the spot remains below the main simple moving averages (SMAs) on the daily chart. The cable is also nearing two-week’s highs and about to challenge the last swing high.
GBP/USD four-hour chart
GBP/USD is approaching the 1.2500 resistance while trading above its main SMAs on the four-hour chart suggesting bullish momentum in the medium term. If the spot break above the above-mentioned level, GBP/USD can continue to appreciate further with bulls setting their eyes on the 1.2600 and 1.2800 figures. Support can be expected near the 1.2400, 1.2300 and 1.2200 figures on any pullback down.
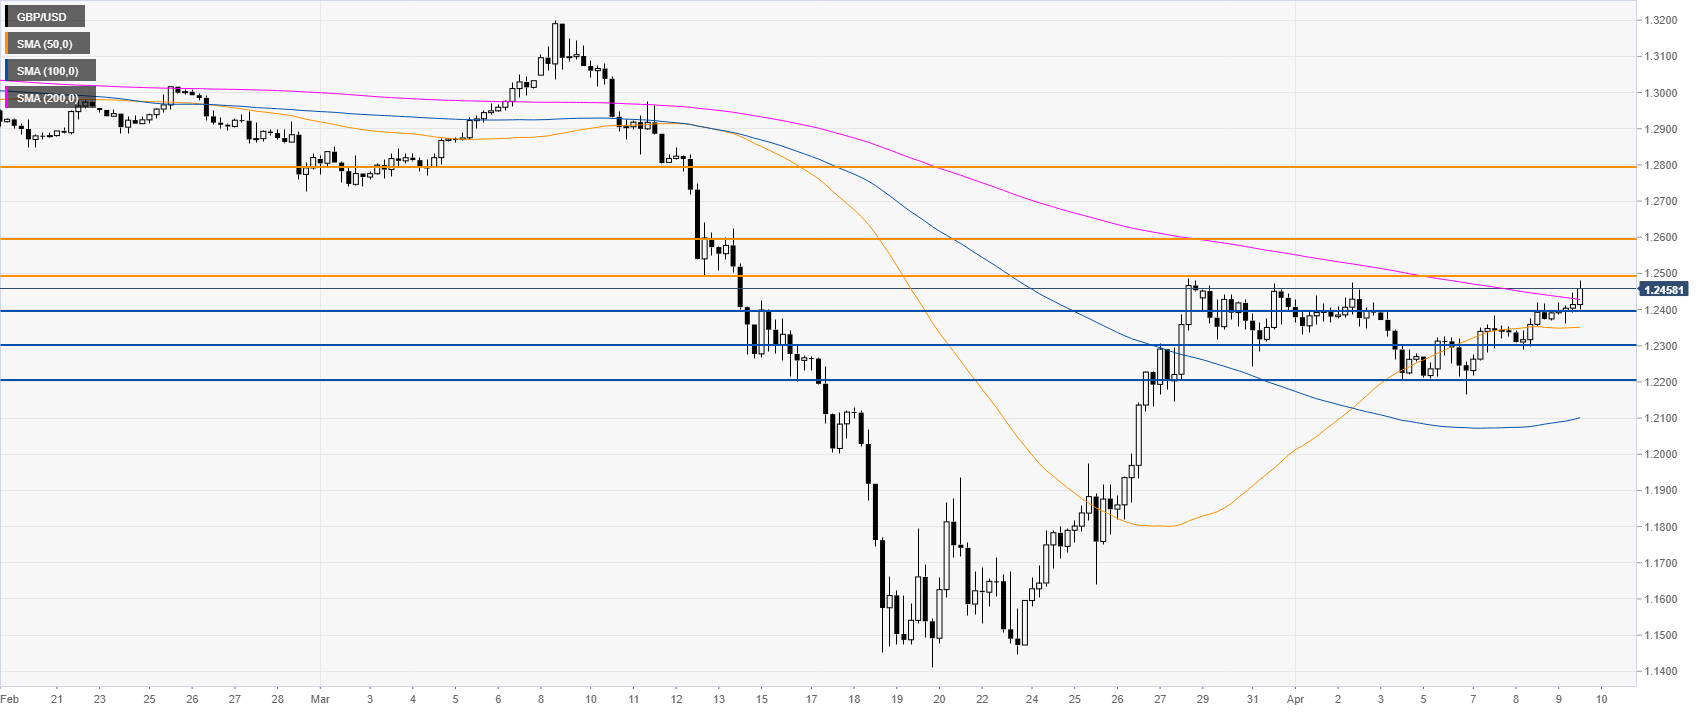
Resistance: 1.2500, 1.2600, 1.2800
Support: 1.2400, 1.2300, 1.2200
Additional key levels
