- AUD/USD is nearing the 50 simple moving average (SMA) on the daily chart.
- The level to beat for bulls is the 0.6400 handle.
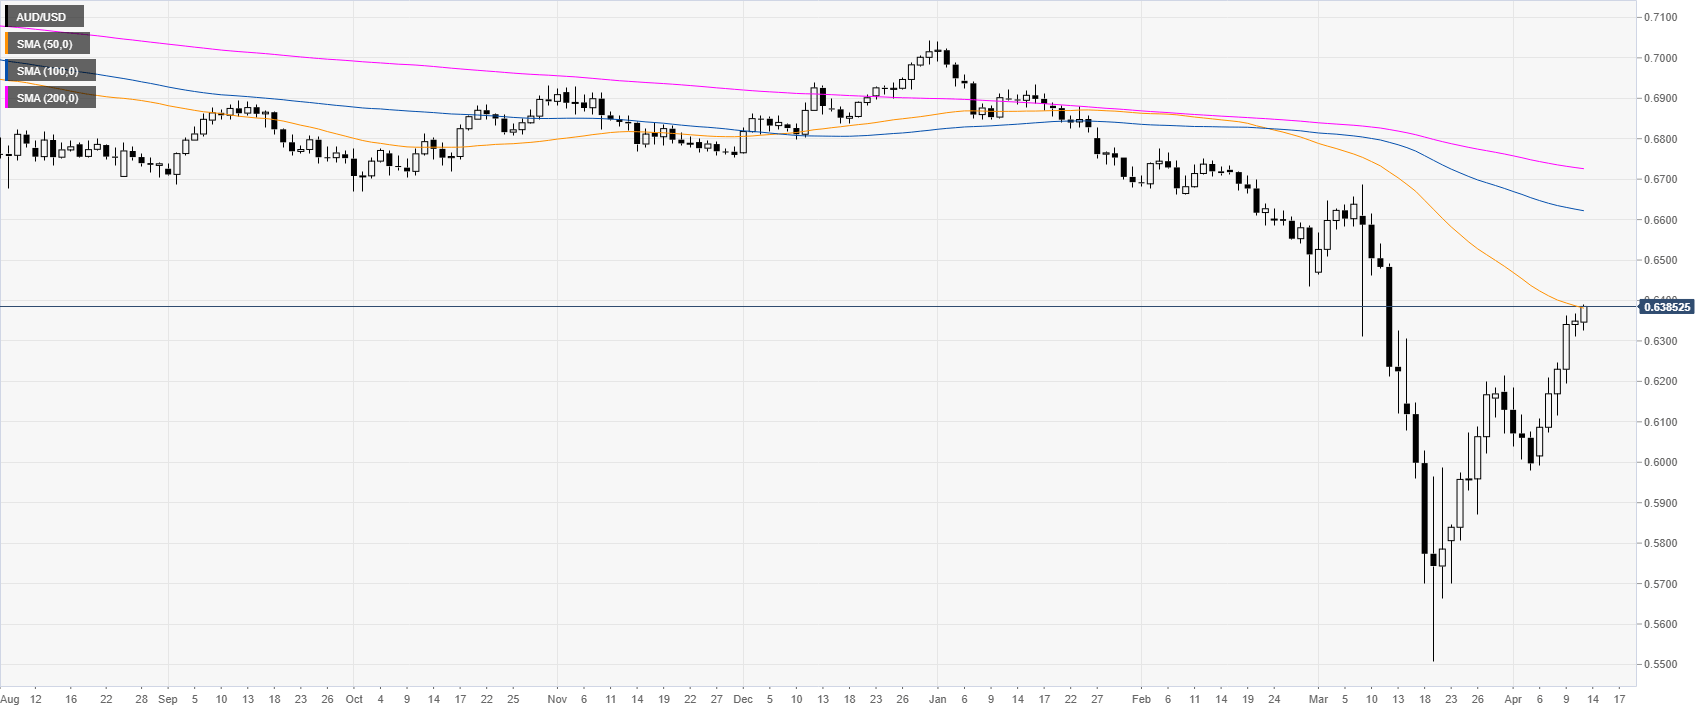
AUD/USD daily chart
AUD/USD bullish recovery is intact as the aussie is trading in one-month highs and challenging the 50 SMA on the daily time frame.
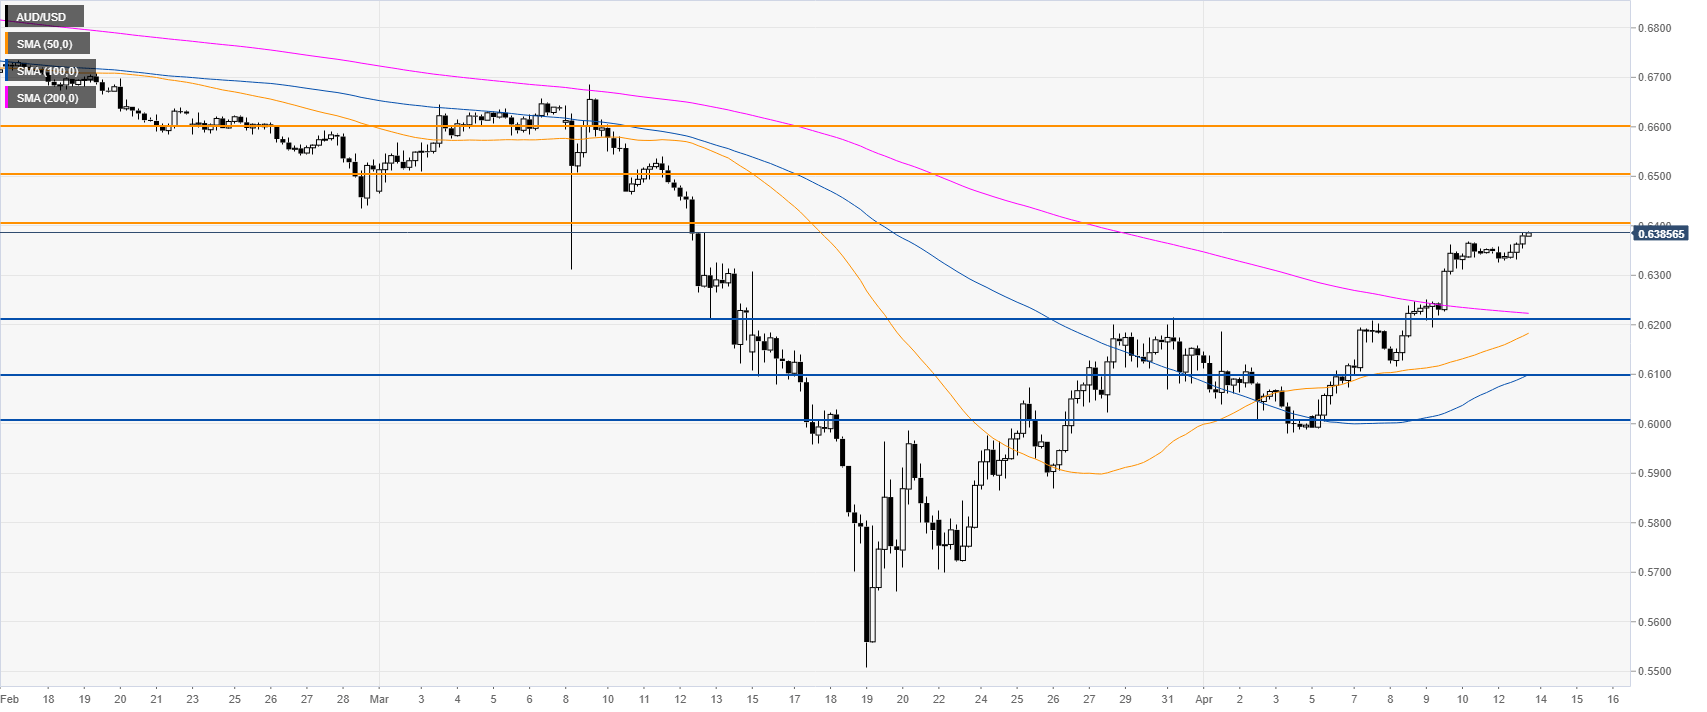
AUD/USD four-hour chart
AUD/USD is trading above the main SMAs on the four-hour chart suggesting bullish momentum in the medium term. A break above 0.6400 should introduce scope for an extension of the current bull run towards higher levels, namely the 0.6500 and 0.6600 figures can be on the bulls’ radar in the near future. Conversely, support is expected to emerge near the 0.6200, 0.6100 and 0.6000 levels on any retracements.
Additional key levels
