- GBP/USD bullish recovery stays intact as the spot holds near 1.2500 level.
- The level to beat for buyers is the 1.2600 resistance.
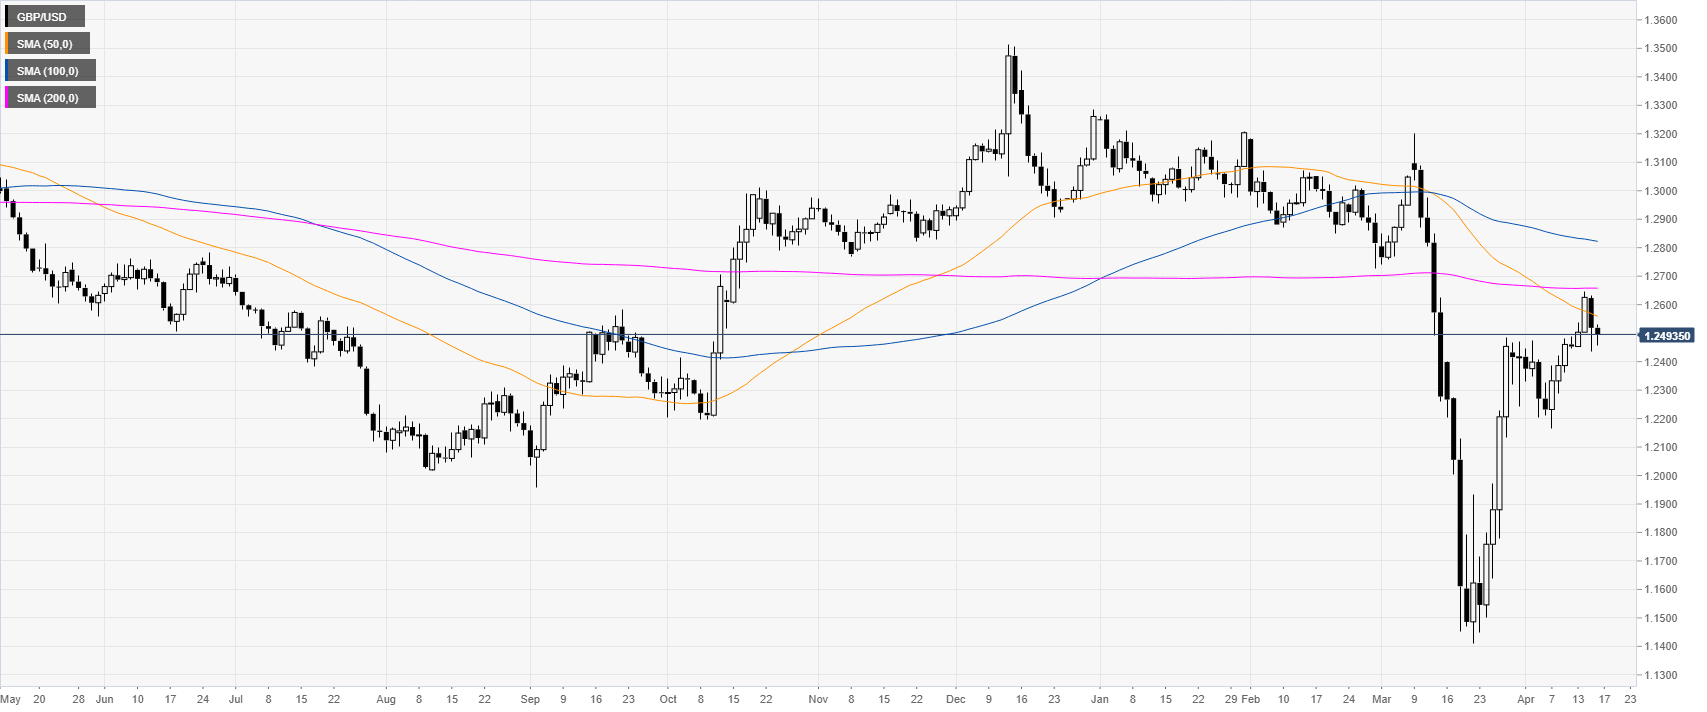
GBP/USD daily chart
GBP/USD is consolidating the recent bullish recovery while rejecting the 1.2600 figure and the 200 SMA on the daily chart.
GBP/USD four-hour chart
GBP/USD is trading above the main SMAs on the four-hour chart suggesting a bullish bias in the medium-term. The spot is hovering around the 1.2500 figure as the market retains the bullishness still printing higher highs and lows. In fact, buyers are looking for a daily close above the 1.2600 figure en route to the 1.2700 and 1.2800 levels. On the flip side, support can emerge near the 1.2500 and 1.2400 level near the 50/200 SMAs.
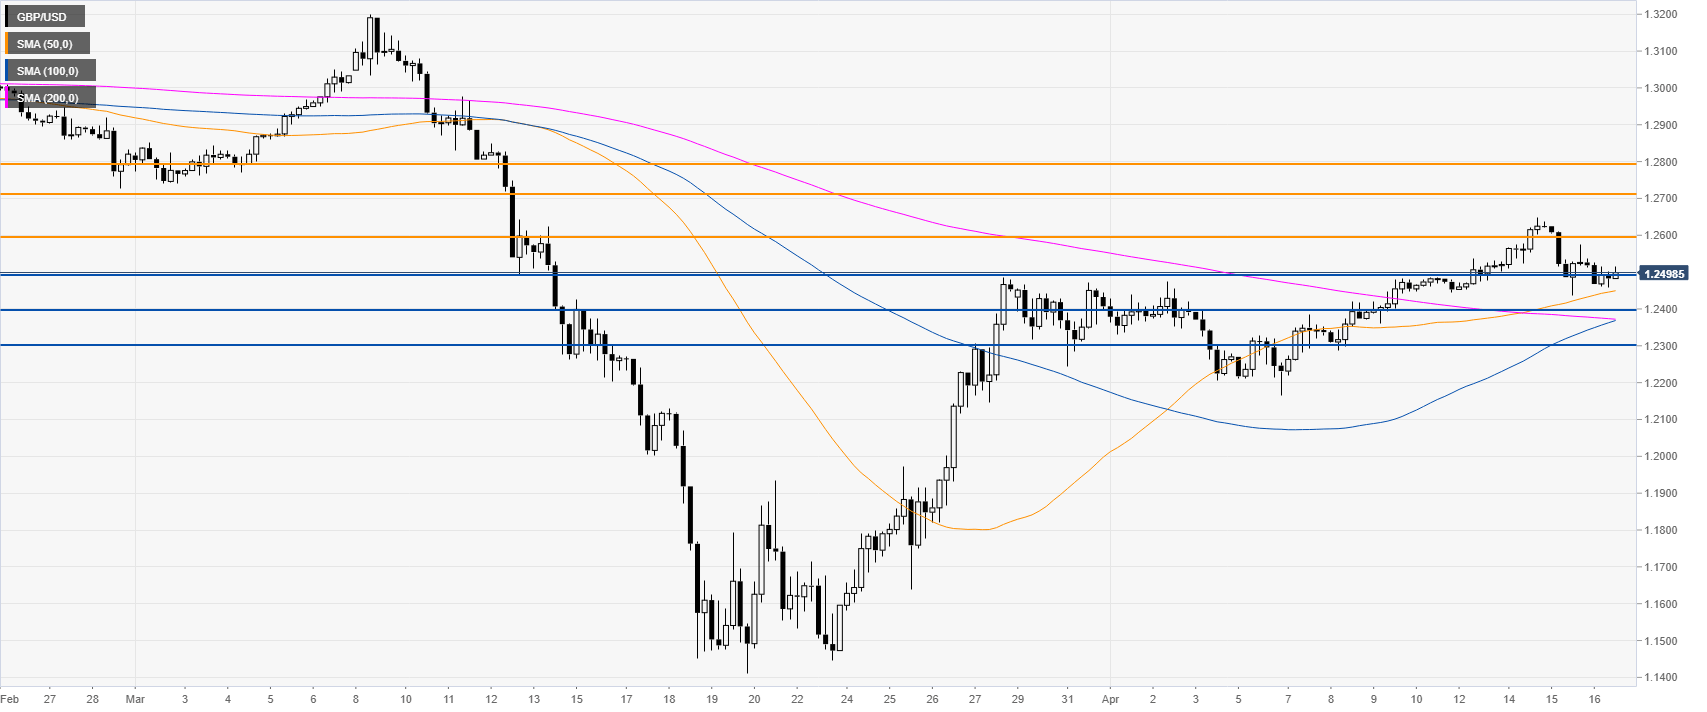
Resistance: 1.2600, 1.2700, 1.2800
Support: 1.2500, 1.2400, 1.2300
Additional key levels
