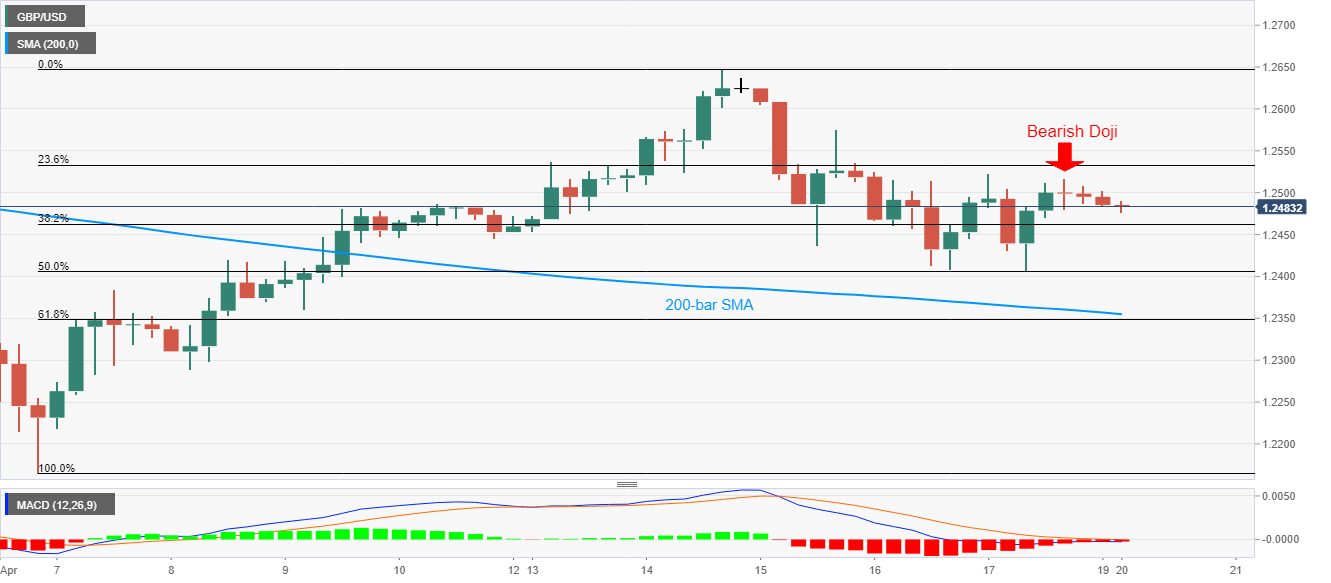
- GBP/USD remains on the back foot after bearish candlestick formation.
- 50% Fibonacci retracement can act as nearby support amid bearish MACD.
- 200-day SMA limits the pair’s near-term upside.
GBP/USD drops to 0.2490, down 0.07% on a day, amid the Asian session on Monday. That said, the pair follows a bearish Doji formation, portrayed Friday, on the four-hour (H4) chart amid the bearish MACD.
As a result, sellers seem to inch closer towards 50% Fibonacci retracement level of the early-month upside, around 1.2405.
However, 200-bar SMA and 61.8% Fibonacci retracement, respectively near 1.2355 and 1.2348, will restrict the pair’s further downside.
Alternatively, an upside clearance of 23.6% Fibonacci retracement level of 1.2535 will negate the bearish candlestick formation and propel the quote towards 1.2575/80.
It should also be noted that the pair’s run-up past-1.2580 depends on how well it manages to cross a 200-day SMA level of 1.2660 on a daily closing basis.
GBP/USD four-hour chart
Trend: Further downside expected
