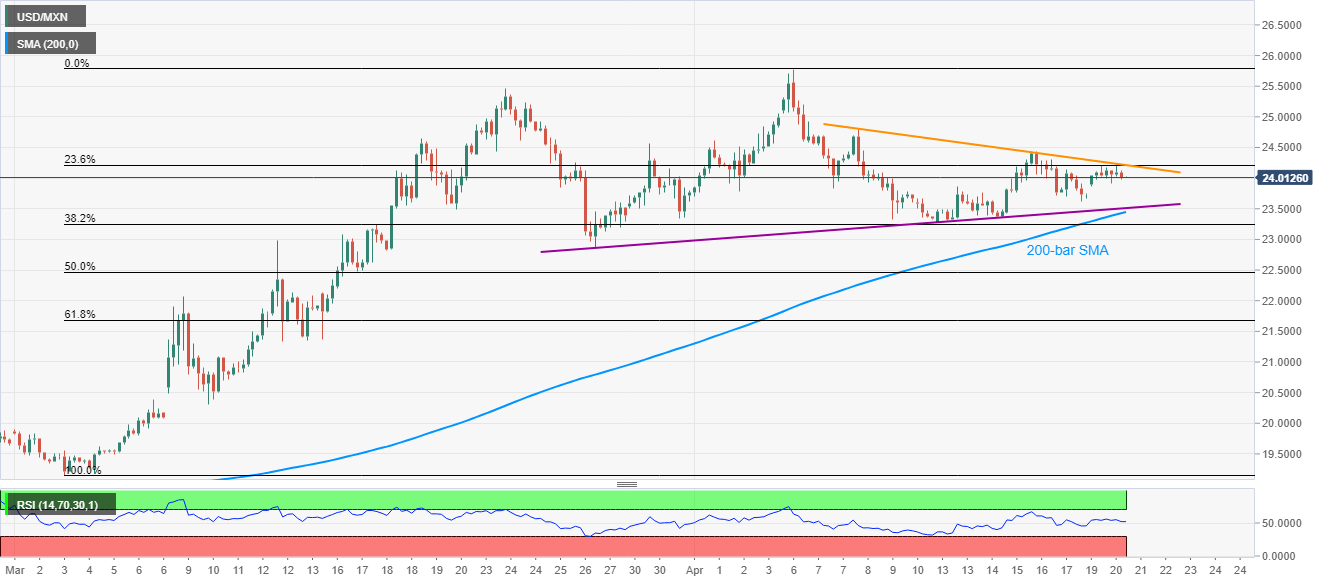
- USD/MXN pulls back from the two-week-old falling trend line.
- A rising support line from March 26, 200-bar SMA limit near-term declines.
USD/MXN drops from near-term key resistance line to 24.02 at the Tokyo on Tuesday. In doing so, the pair also takes a U-turn from 23.6% Fibonacci retracement of March-April upside.
As a result, the pair traders may now keep eyes on 23.50/45 support confluence, including 200-bar SMA and an ascending trend line since March 26, 2020, during the further declines.
If at all the quote stays weak past-23.45, March 09 top surrounding 22.05 and 61.8% Fibonacci retracement close to 21.68 might lure the bears.
Alternatively, an upside clearance of 24.25 could push the pair to the north towards 24.80 and 25.00.
Also, March 23 high around 25.45 can offer an intermediate halt during the pair’s upside past-25.00 and ahead of the monthly peak of 25.78.
USD/MXN four-hour chart
Trend: Pullback expected
