- USD/IDR holds onto recovery gains from the key Fibonacci retracement level.
- 21-day SMA guards the immediate upside.
- Early-March tops will lure the bears during the further declines.
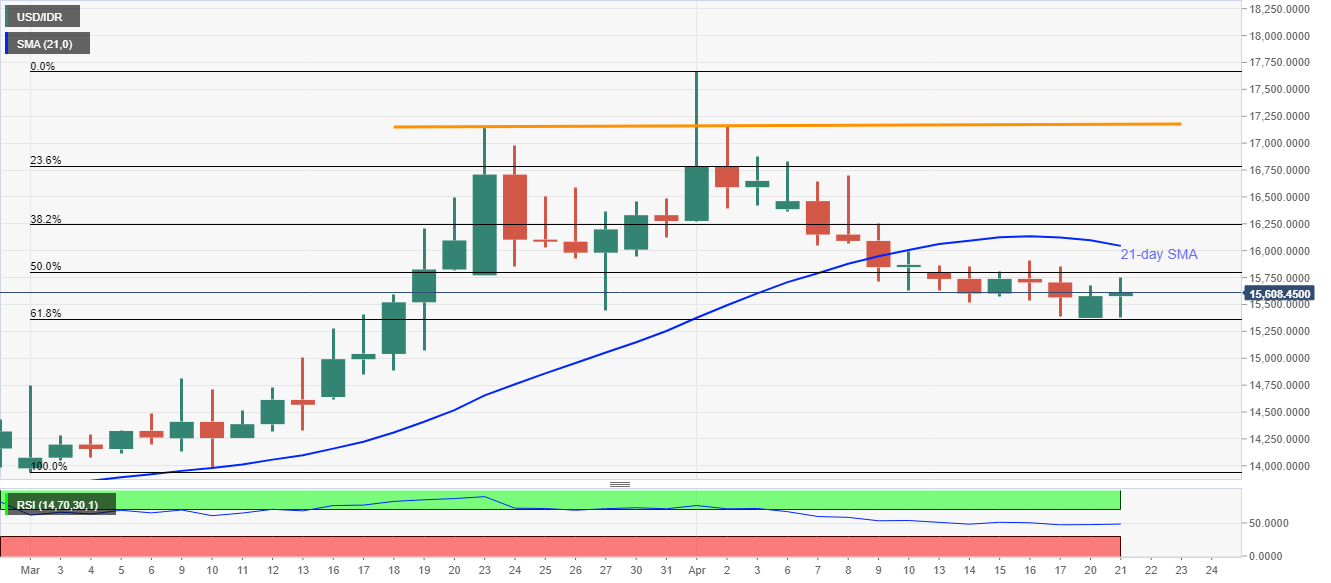
While extending the recovery gains from the key Fibonacci retracement support, USD/IDR stays mildly positive around 15,608, up 0.2% on a day, ahead of the European session open on Tuesday.
The pair currently aims to confront 50% Fibonacci retracement level of March-April upside, at 15,800, whereas 21-day SMA, currently near 16,045, could cap the pair’s further recoveries.
In a case where the buyers keep the helm above 16,045, 16,600 and 16,900 might offer intermediate halts before pushing the quote to a horizontal line, comprising highs marked on March 23 and April 02, around 17,150/55.
On the flip side, the pair’s daily closing below 15,360, encompassing the said Fibonacci retracement level, could recall the early-March tops surrounding 14,800 on the charts.
USD/IDR daily chart
Trend: Further recovery expected
