- GBP/USD consolidates losses near a two-week low.
- MACD teases bears trying to cheer a break of near-term key SMA.
- 61.8% Fibonacci retracement, 200-day SMA adds to the resistances.
GBP/USD retraces losses near two-week low, up 0.05% on a day to 1.2300, as traders in Tokyo head for the day’s work on Wednesday.
Even so, the Cable stays below 21-day SMA for the first time in a month which together with weak MACD histogram suggests further weakness towards the monthly low around 1.2165.
However, a horizontal line connecting March 18 high and March 27 low, around 1.2130/35, could question the pair’s further declines.
Meanwhile, an upside clearance of 1.2380, comprising 21-day SMA, could trigger recovery moves towards 61.8% Fibonacci retracement of the pair’s March month downside, close to 1.2520.
Though, buyers are likely to remain worries unless witnessing a daily closing past-200-day SMA level of 1.2655.
GBP/USD daily chart
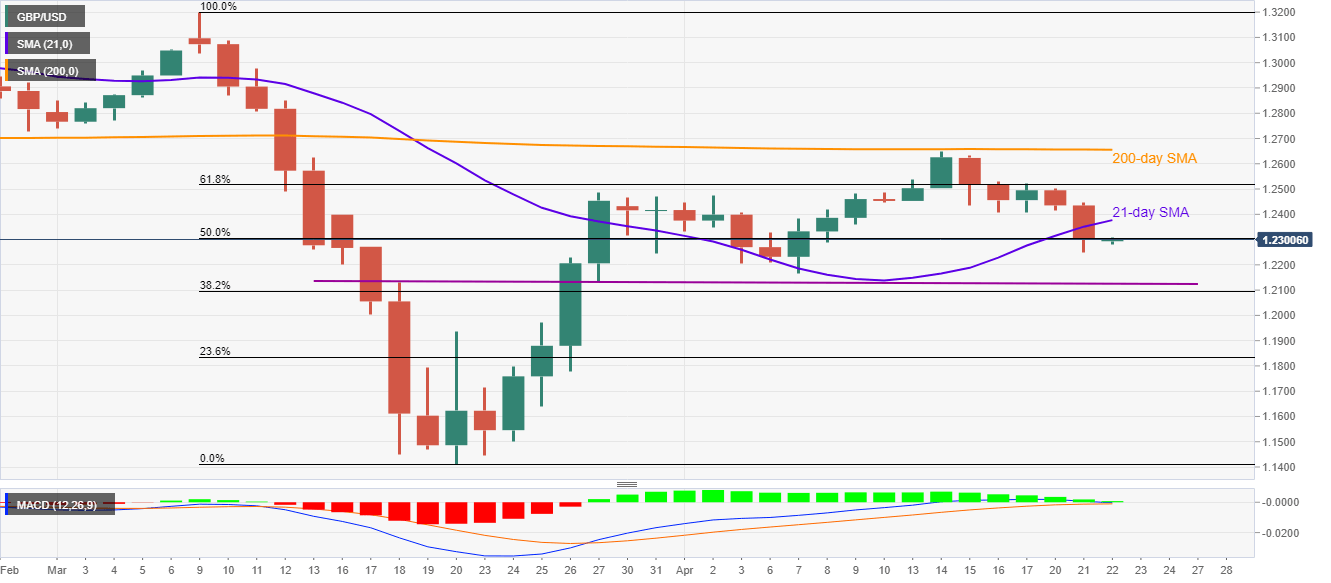
Trend: Bearish
