- DXY struggles to clear the barrier at the 100.50 region.
- Immediately to the upside emerges the April’s top near 101.00.
The upside momentum in DXY faltered in the mid-100.00s for the time being, sparking some near-term correction to the 100.00 neighbourhood at the time of writing.
If sellers regain the upper hand, then the 55-day SMA at 99.17 should emerge as the initial contention ahead of weekly lows near 98.80. Further extension of the downside should leave recent tops in the 100.50 region as an interim peak.
Furthermore, the constructive bias is seen unchanged above the 200-day SMA, today at 98.25.
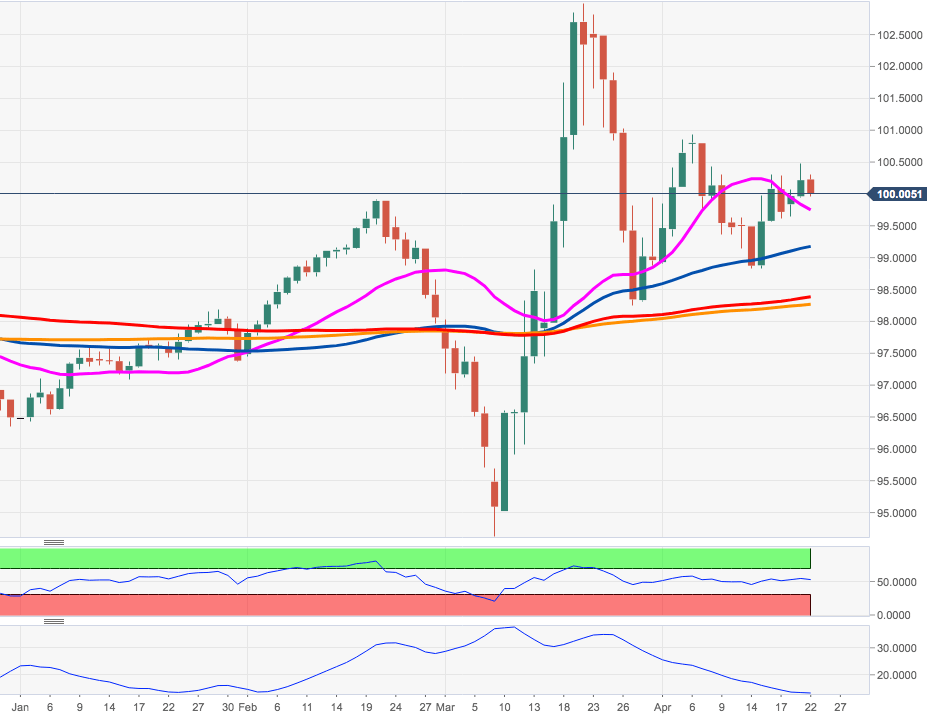
DXY daily chart