- XAG/USD consolidates losses near $15.00/oz.
- Sideways to down more likely as long as silver is below the 15.00 level.
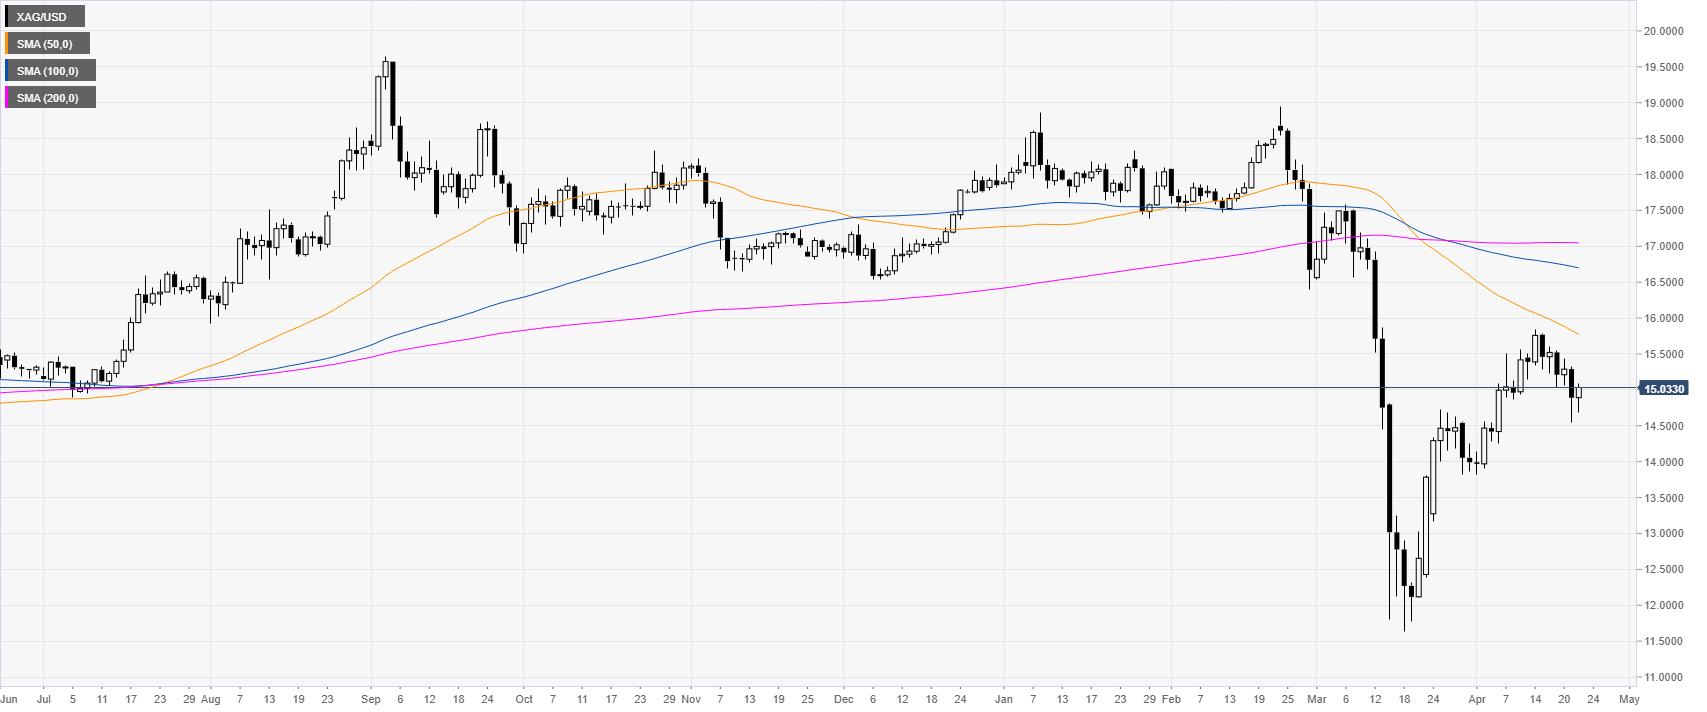
Silver daily chart
XAG/USD is pulling back down following the sharp bull-run from mid-March. However, the metal is trading below its main SMAs on the daily chart suggesting an overall negative bias.
Silver four-hour chart
XAG/USD is consolidating the recent drop below the 15.00 mark and the 50 SMA on the four-hour chart. The market is battling with the 15.00 level and the 100 SMA however it is unclear if buyers can resume the bull trend for much longer as the market is trading above the 200 SMA but this one is tilted to the downside. A sideways market is, for now, the most likely outcome with a potential return of bears eyeing a break below the 14.50 level.
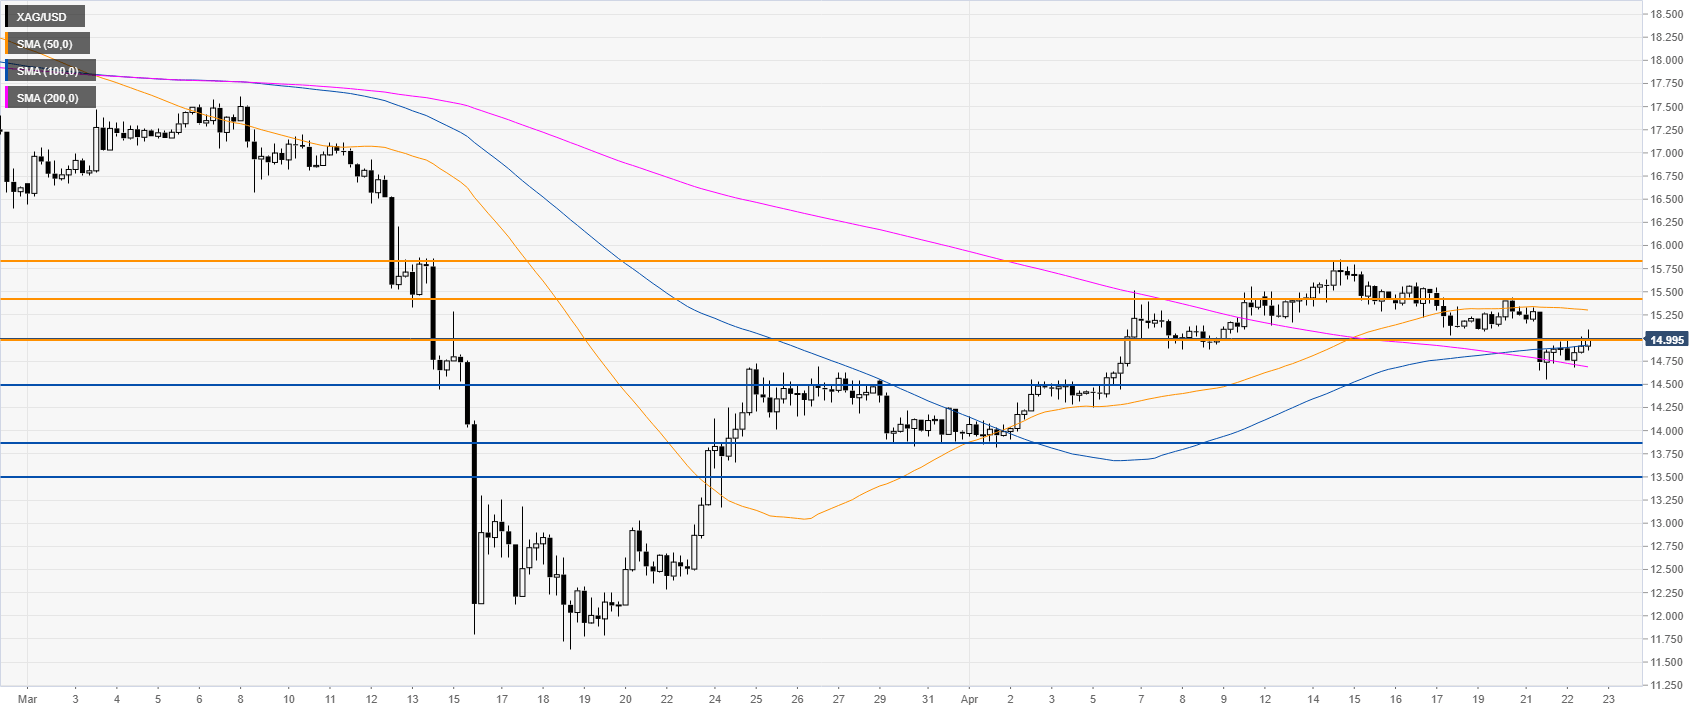
Resistance: 15.00, 15.43, 15.80
Support: 14.50, 13.90, 13.50
Additional key levels
