- US dollar index (DXY) ends Wednesday above the 100.00 mark.
- The level to beat for bulls is the 100.50 resistance.
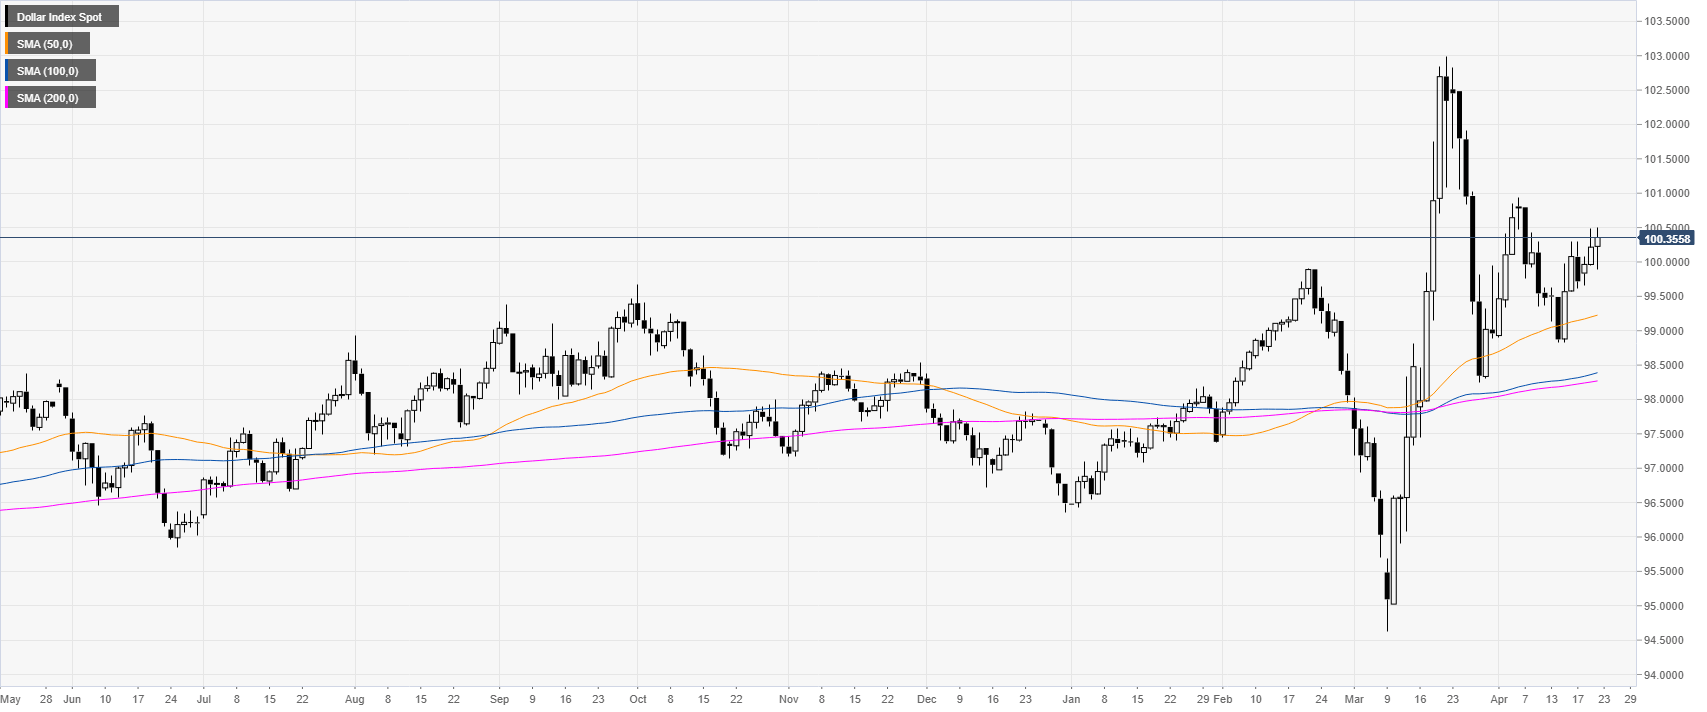
DXY daily chart
DXY is trading above the main SMAs on the daily chart as the index settles above the 100.00 mark on the third day of the week.
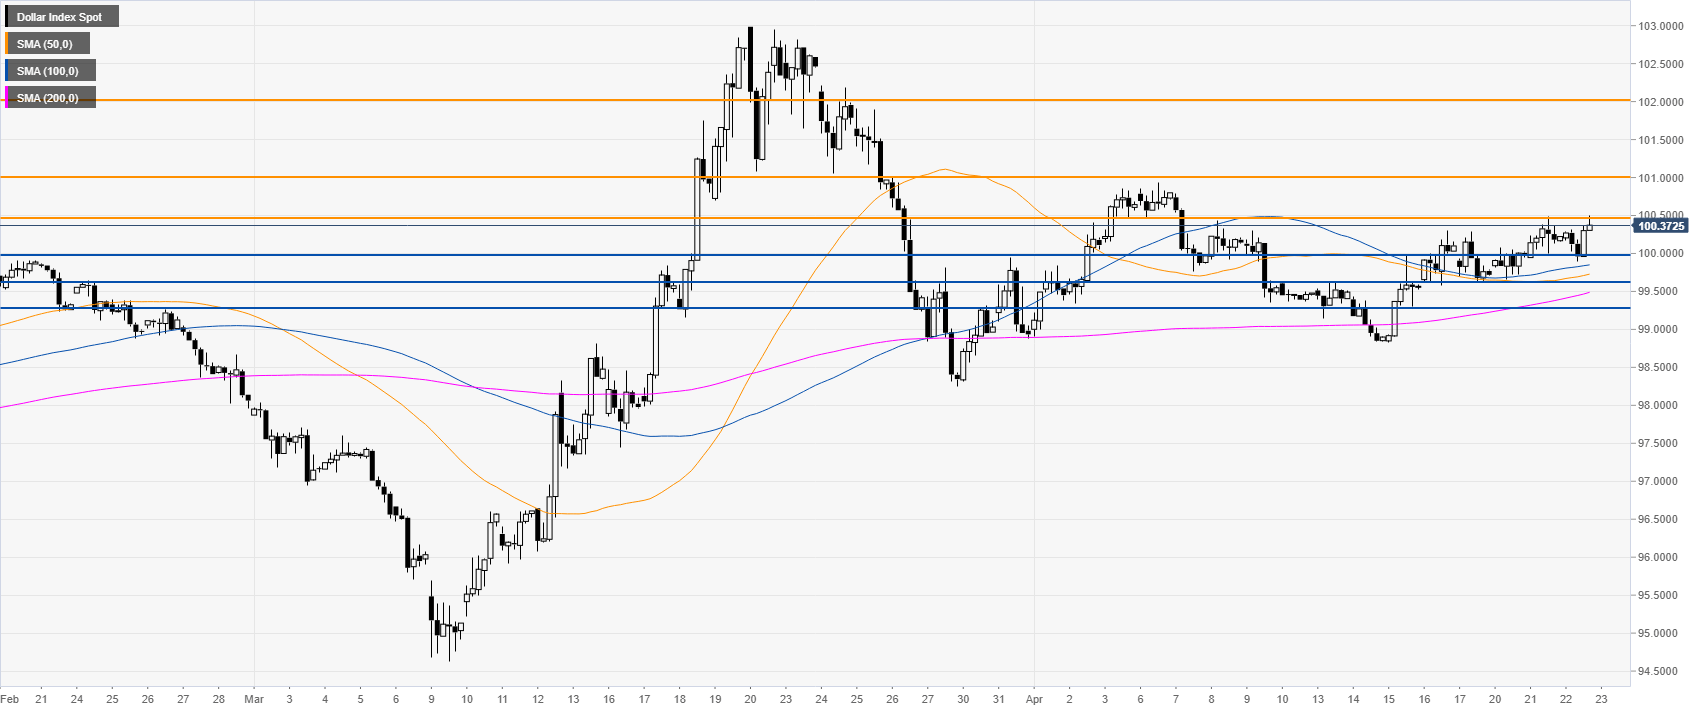
DXY four-hour chart
DXY is turning higher while above the main SMAs on the four-hour chart. The uptrend remains intact as the greenback holds on above the 100.00 mark as the market can continue to climb above the 100.50 level en route to the 101.00 price levels. Support can be seen near 100.00 and 99.60 levels.
Additional key levels
