- USD/MXN struggles for direction after a three-day winning streak.
- The candlestick formation signals buyers’ exhaustion.
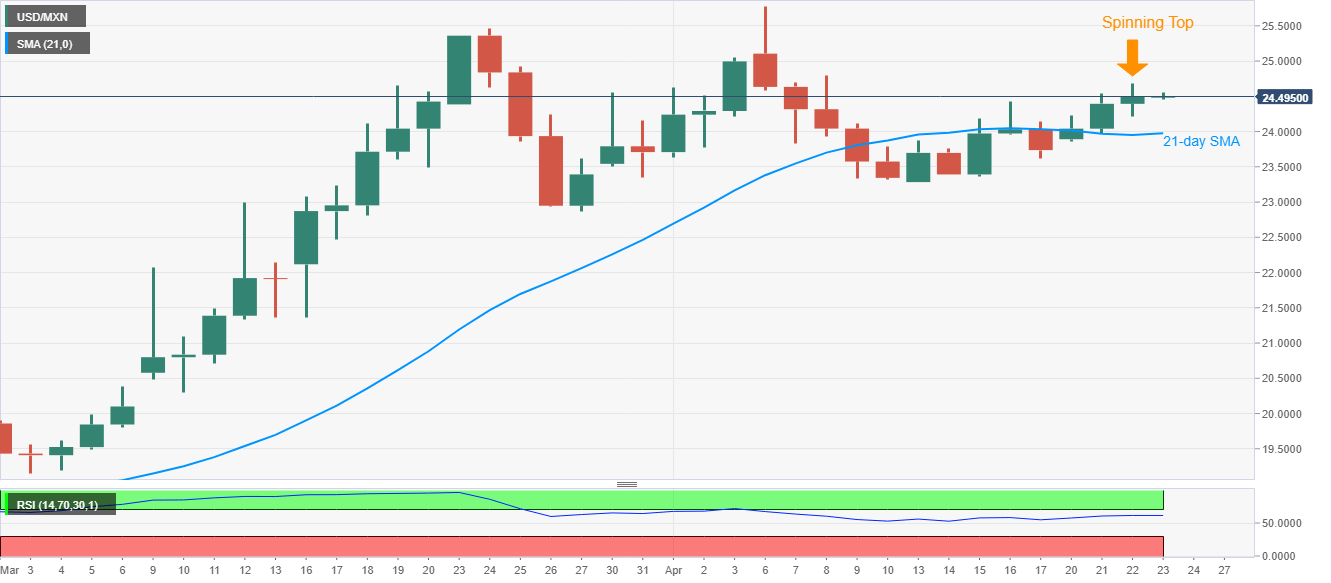
- 21-day SMA acts as immediate support.
USD/MXN stays modestly changed near 24.50 after witnessing a pullback from 24.40 in the last hours during Thursday’s Asian session. The pair portrays spinning top candlestick on the daily (D1) chart, which in turn suggests buyers’ exhaustion after three consecutive days of run-up.
Hence, sellers can look for a pullback towards a 21-day SMA level of 23.98 during the fresh declines.
However, the monthly low surrounding 23.28 and the late-March bottom close to 22.86 could challenge the bears afterward.
Meanwhile, an upside break above 24.70 will deft the candlestick pattern and could further escalate the recovery moves towards 25.00 and 25.46 ahead of challenging the record top near 25.78.
USD/MXN daily chart
Trend: Pullback expected
