- USD/INR confirms multi-day-old rising wedge bearish technical pattern.
- 21-day SMA checks the sellers, 77.00 acts as near-term key resistance.
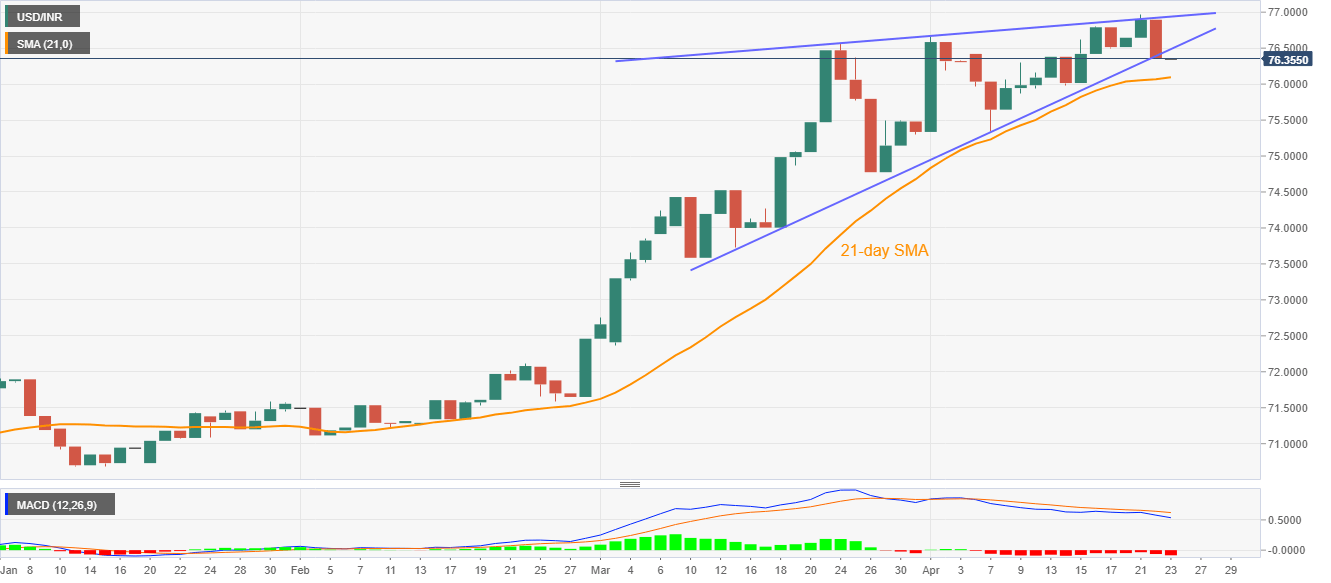
While extending its break below the six-week-old rising trend line, USD/INR drops to 76.22, down 0.25% on a day, during the pre-European session on Thursday. In doing so, the pair confirms short-term rising wedge bearish formation.
Given the MACD also flashes bearish signals, the pair’s further downside can’t be ruled out. However, a daily closing below 21-day SMA level of 76.10 becomes necessary for that.
Should the quote slips below 76.10, it then becomes vulnerable to eye the theoretical target of 73.20/25. Though, late-March low near 74.77 could offer an intermediate halt during the slump.
Meanwhile, the pair’s daily closing beyond the support-turned-resistance line of 76.50 defies the latest break down and again pushes the pair towards 77.00.
If at all bulls manage to dominate beyond 77.00, their run-up to 80.00 psychological magnet can be expected
USD/INR chart
Trend: Further declines expected
