- US dollar index (DXY) ends Thursday above the 100.00 mark.
- The level to beat for buyers is the 100.50 resistance.
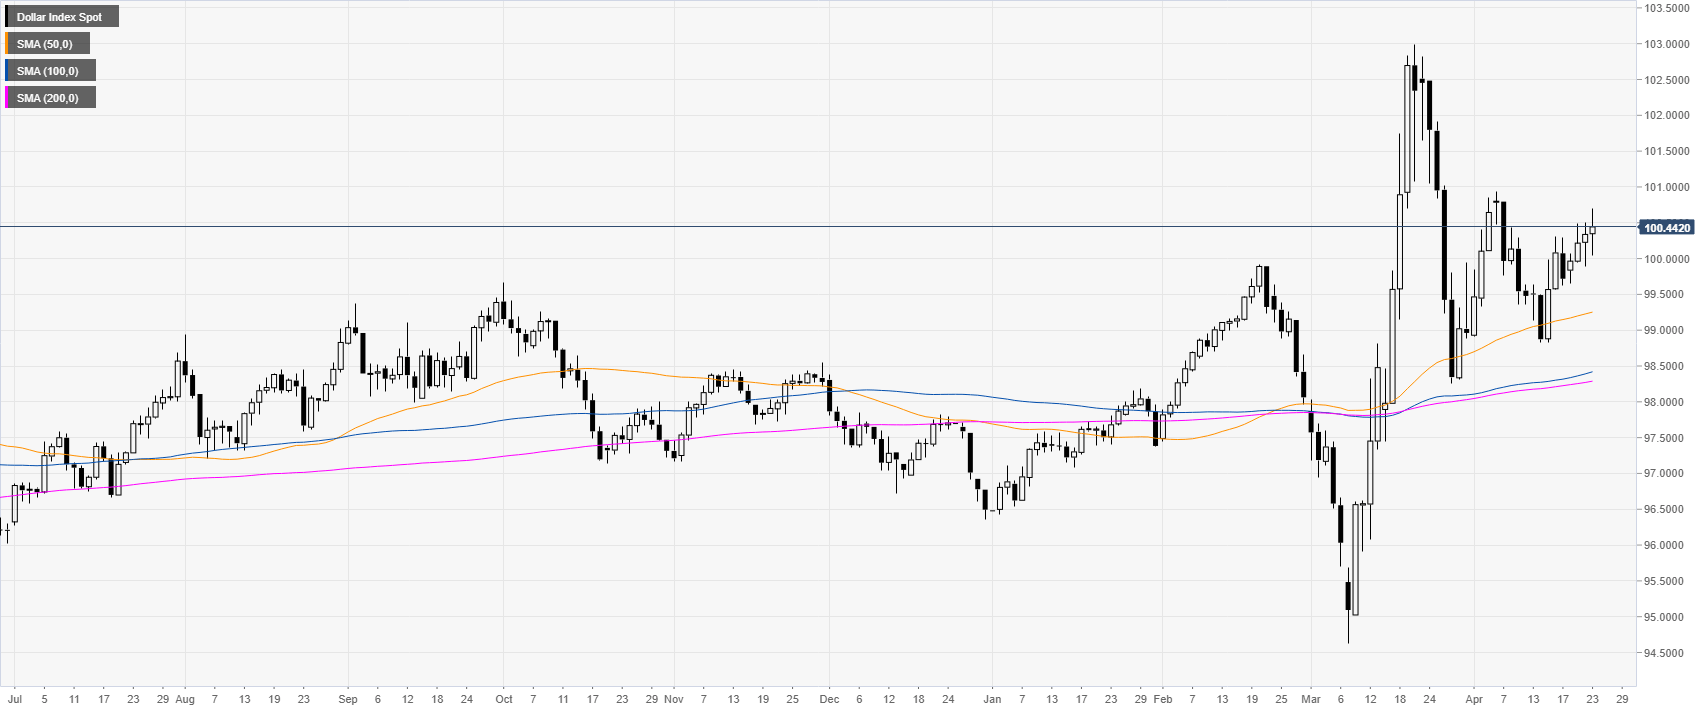
DXY daily chart
DXY is trading above the main SMAs on the daily chart as the index continues the bullish grind and settles above the 100.00 mark on the fourth day of the week.
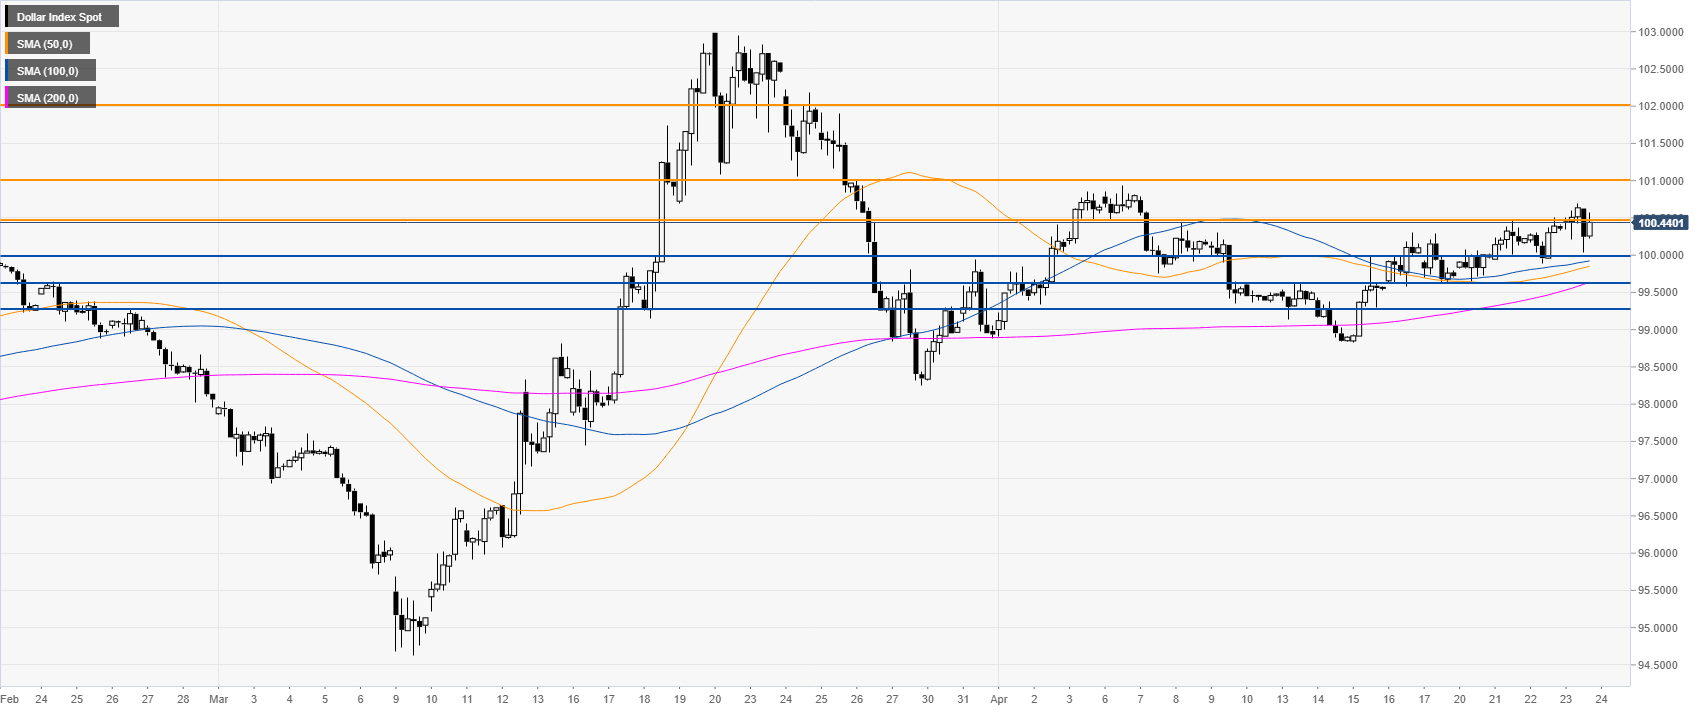
DXY four-hour chart
DXY broke above the 100.50 intraday but is on track to end the New York session below it. However, the uptrend remains, for now, intact as the greenback holds above the 100.00 figure with bulls still eyeing the 100.50 level en route to the 101.00 figure. Support can be seen near the 100.00 and 99.60 levels.
Additional key levels
