Gold has been taking two steps forward, one step back as the week draws to a close. How is it positioned on the technical charts?
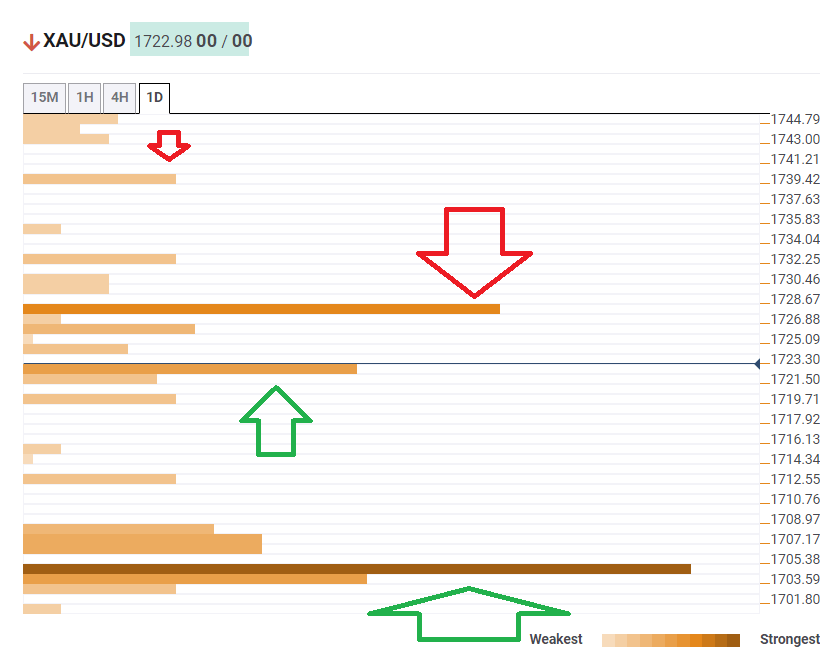
The Technical Confluences Indicator is showing that the precious metal faces resistance at $1,727, which is the convergence of the Fibonacci 38.2% one-day, the Simple Moving Average 10-1h, the SMA 50-15m, the Bollinger Band one-hour Middle, and the Pivot Point one-week Resistance 1.
Further up, there are no significant hurdles, yet $1,739 would be a noteworthy target. It was the previous day’s high.
Support awaits at $1,722, which is the confluence of the Fibonacci 61.8% one-week, the previous 4h-low, and the Bollinger Band 15min-Lower.
Further down, strong support awaits at $1,704, which is the confluence of the PP one-month Resistance 1, the BB 4h-Middle, the previous monthly high, and the SMA 5 one-day.
Here is how it looks on the tool:
Confluence Detector
The Confluence Detector finds exciting opportunities using Technical Confluences. The TC is a tool to locate and point out those price levels where there is a congestion of indicators, moving averages, Fibonacci levels, Pivot Points, etc. Knowing where these congestion points are located is very useful for the trader, and can be used as a basis for different strategies.
This tool assigns a certain amount of “weight” to each indicator, and this “weight” can influence adjacents price levels. These weightings mean that one price level without any indicator or moving average but under the influence of two “strongly weighted” levels accumulate more resistance than their neighbors. In these cases, the tool signals resistance in apparently empty areas.
Learn more about Technical Confluence
