- XAG/USD recovery from 2020 lows remains intact.
- The level to beat for buyers is the 15.43 level.
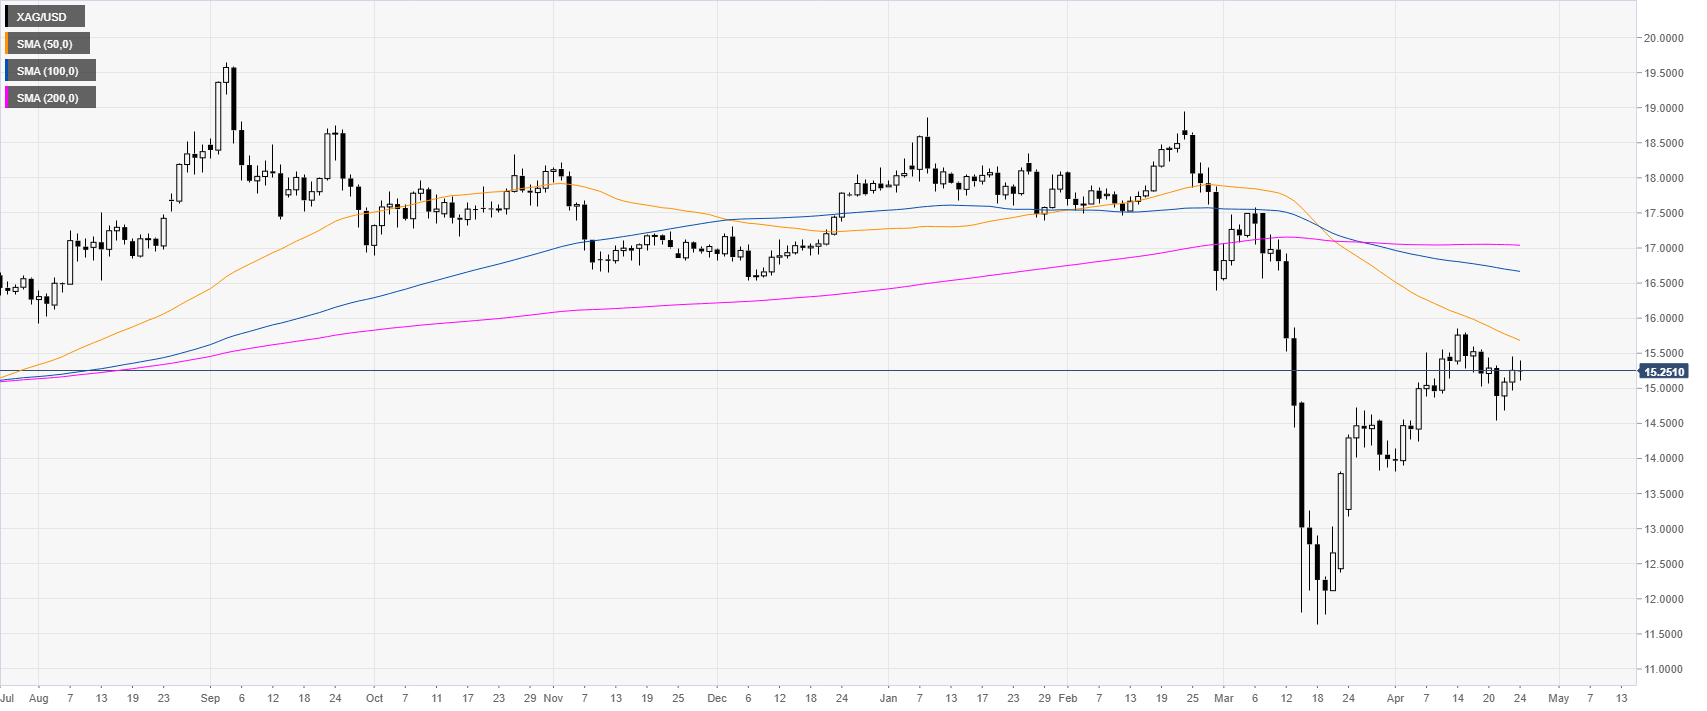
Silver daily chart
XAG/USD consolidates the steep bull-run from mid-March. However, the metal is still trading below its main SMAs on the daily chart suggesting an overall negative bias.
Silver four-hour chart
XAG/USD keeps challenging the 15.43 resistance and the 50 SMA on the four-hour chart as the buyers are looking for a potential breakout above this level. In fact, a daily close above 15.43 can yield further advances towards the 15.85 level (April high) and the 16.50 resistance. Conversely, support can be seen near 15.00 and 14.50.
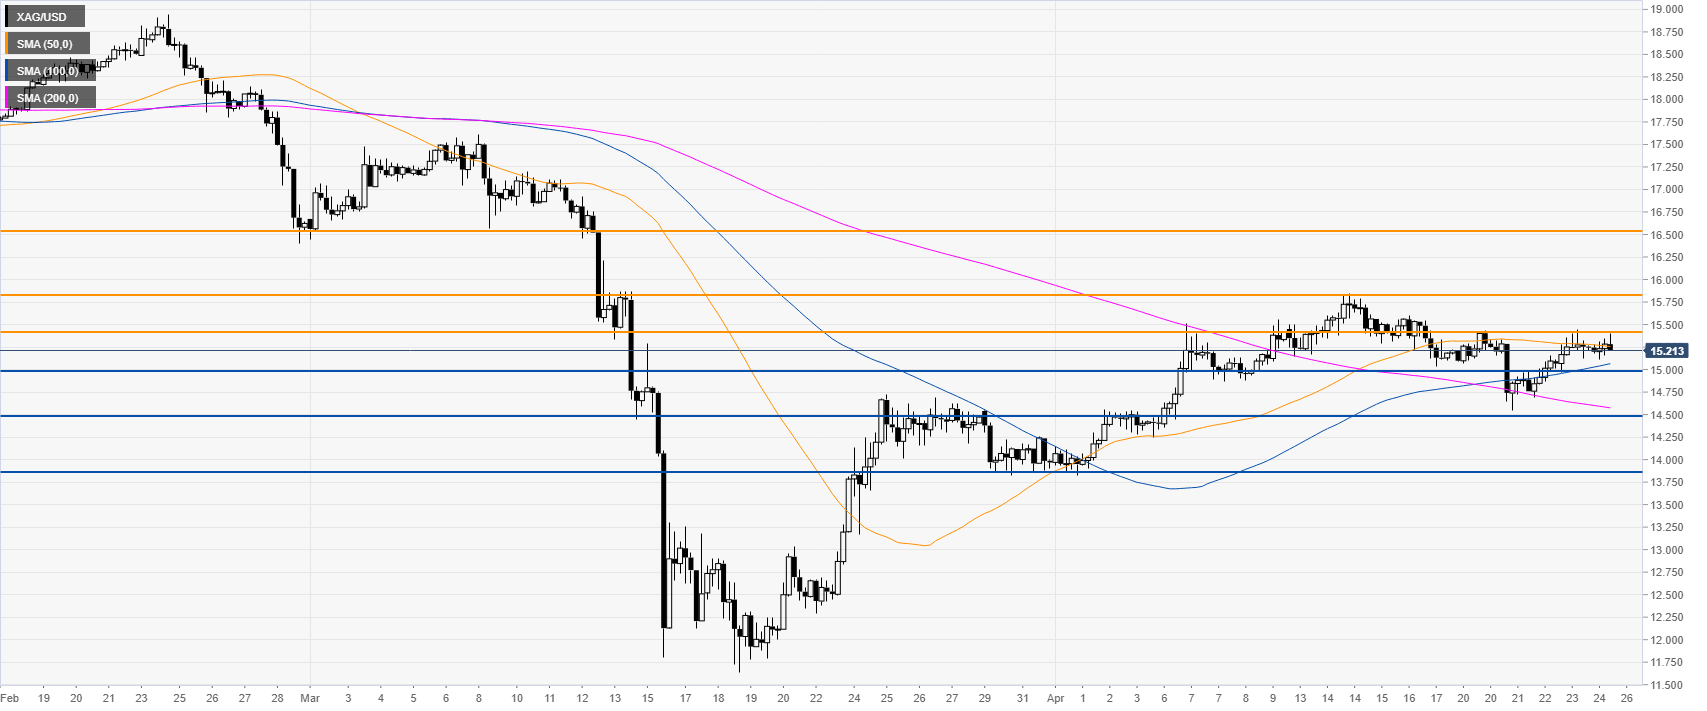
Resistance: 15.43, 15.85, 16.50
Support: 15.00, 14.50, 13.90
Additional key levels
