- GBP/USD gradually recovers to a short-term key resistance line.
- Sustained trading beyond 200-bar SMA, bullish MACD keeps buyers hopeful.
- 61.8% Fibonacci retracement adds to the upside filters.
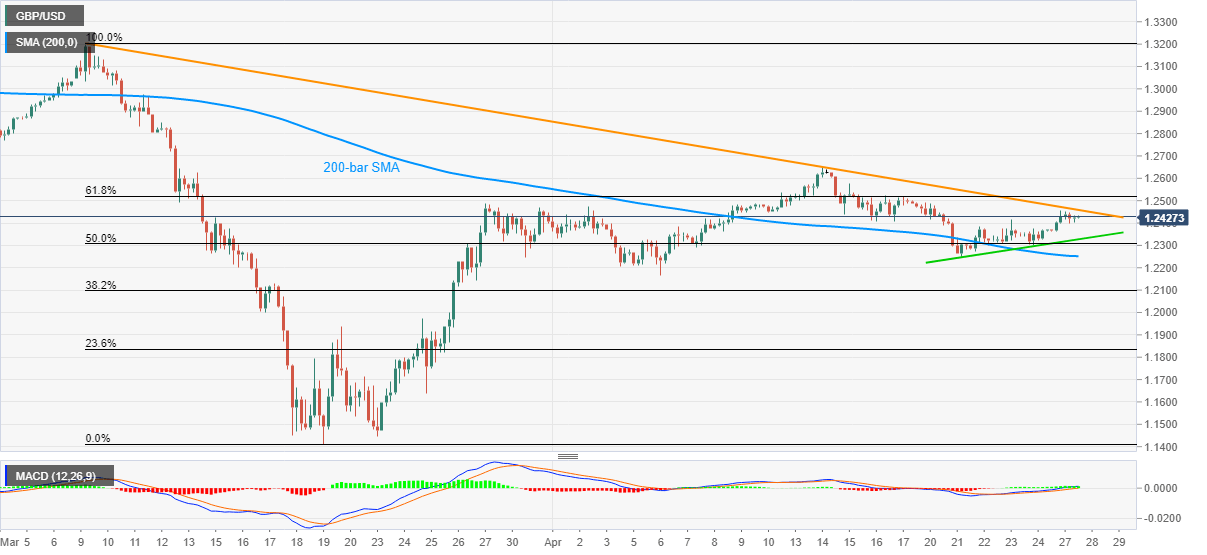
While extending its early-week recovery, though modestly, GBP/USD makes rounds to 1.2430 during the early Tuesday’s Asian session. In doing so, the Cable pair nears a downward sloping trend line since March 09 amid bullish MACD signals.
Additionally, the pair’s sustained trading beyond 200-bar SMA and a week-old rising trend line also keep the buyers hopeful.
As a result, the short-term resistance trend line, currently near 1.2460, is on the bulls’ radars ahead of 61.8% Fibonacci retracement of March month downside.
Should the quote manage to successfully cross the 1.2520 Fibonacci retracement level, it can question the monthly high surrounding 1.2650 during the further upside.
Alternatively, the immediate rising support line, near 1.2330, and 200-bar SMA close to 1.2310/05, seem to restrict the pair’s nearby downside ahead of the monthly bottom surrounding 1.2165.
GBP/USD four-hour chart
Trend: Further recovery expected
