- GBP/USD bullish reversal remains intact as the spot holds above the 1.2400 level.
- The level to beat for buyers the 1.2500 resistance.
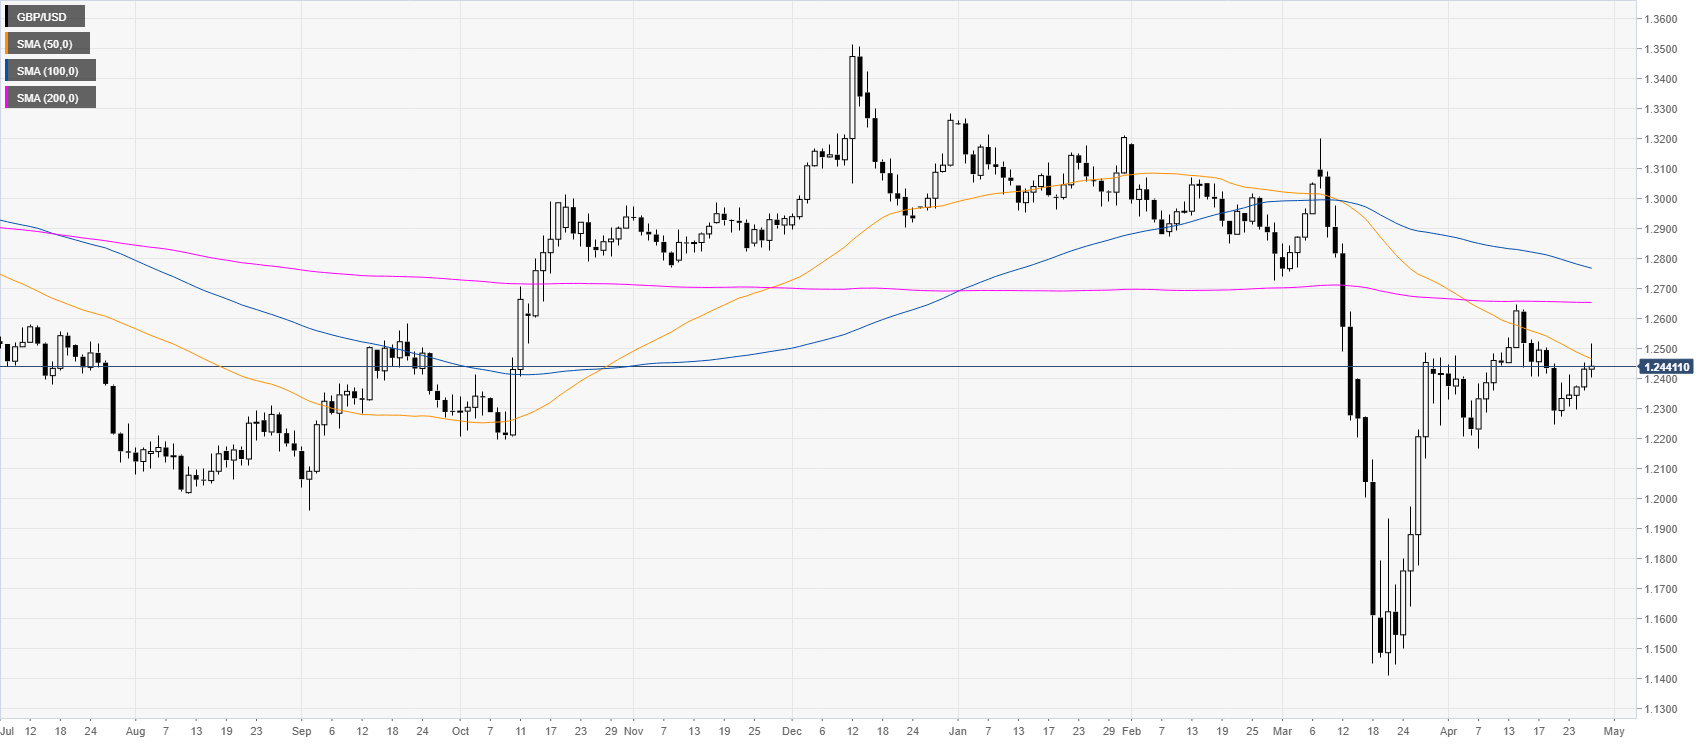
GBP/USD daily chart
The recovery from mid-March remains intact as the spot consolidates above the 1.2300 figure but below the main SMAs on the daily chart.
GBP/USD four-hour chart
GBP/USD is trading above the main SMAs on the four-hour chart as the spot formed a convincing base in April. Although GBP/USD dipped slightly this Tuesday, bulls are still likely to be looking for a break above the 1.2500 figure en route towards the 1.2600 and 1.2700 levels. Conversely, support is can be seen near 1.2400 and 1.2300 levels.
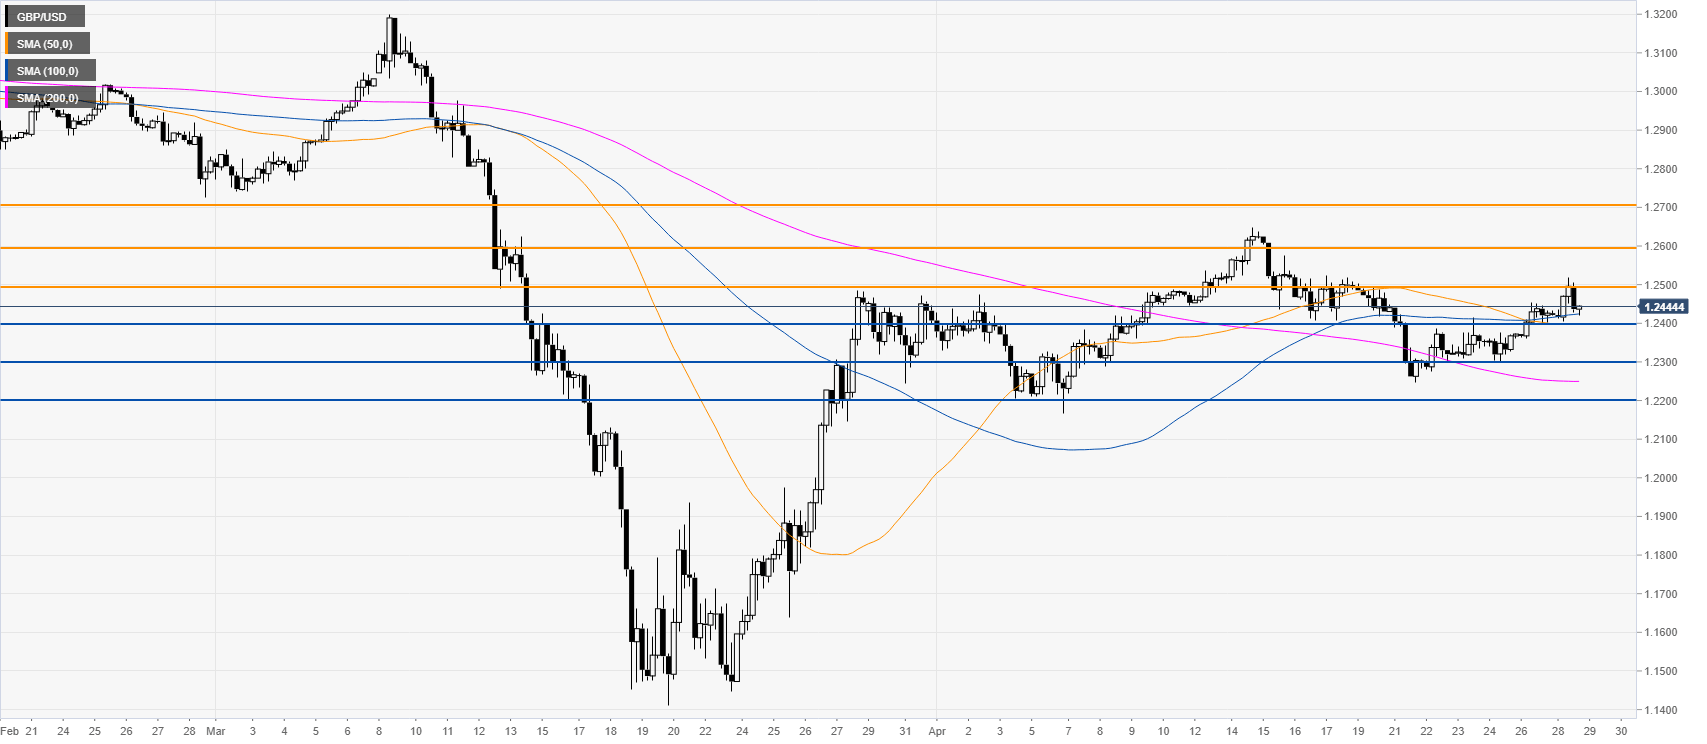
Resistance: 1.2500, 1.2600, 1.2700
Support: 1.2400, 1.2300, 1.2200
Additional key levels
