- Gold registers four-day losing streak.
- MACD turns bearish for the first time in a month.
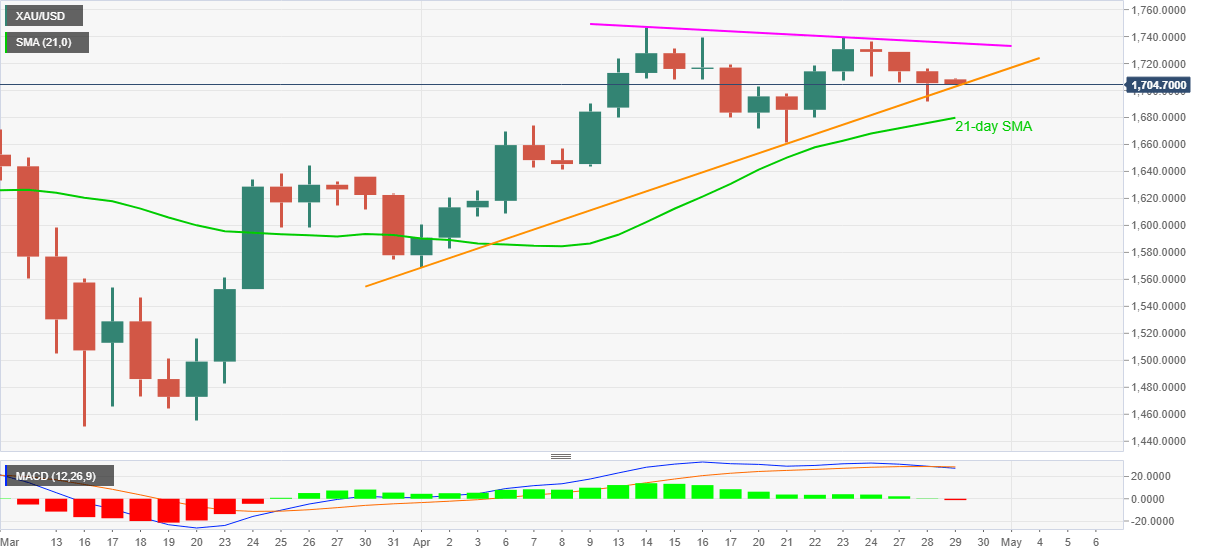
- Four-week-old support line restricts immediate declines, 21-day SMA adds to the support.
- A two-week-old resistance line guards the recovery moves.
Gold prices drop to $1,704.70, down 0.16% on a day, amid the early Asian session on Wednesday. In doing so, the bullion extends the previous three-day declines while staying above the monthly support line.
Even so, the MACD turns bearish for the first time since March 24. As a result, bears will look for entry below $1,700 while targeting the 21-day SMA level of $1,679.
It should also be noted that the previous week’s low near $1,660 and the late-March top near $1,645 will be on the bears’ radars after breaking the 21-day SMA.
On the contrary, the precious metal’s pullback moves may have to clear $1,720 ahead of confronting a fortnight-long falling resistance line, currently near $1,735.
In a case where buyers manage to cross $1,735 on a daily closing basis, it’s the run-up to challenge the multi-year high near $1,748 can be witnessed.
Gold daily chart
Trend: Further downside likely
