- Gold struggles to extend the previous day’s recovery moves.
- A one-week-old resistance line adds to the upside barriers.
- Sellers can have 50% Fibonacci retracement as an extra rest-point.
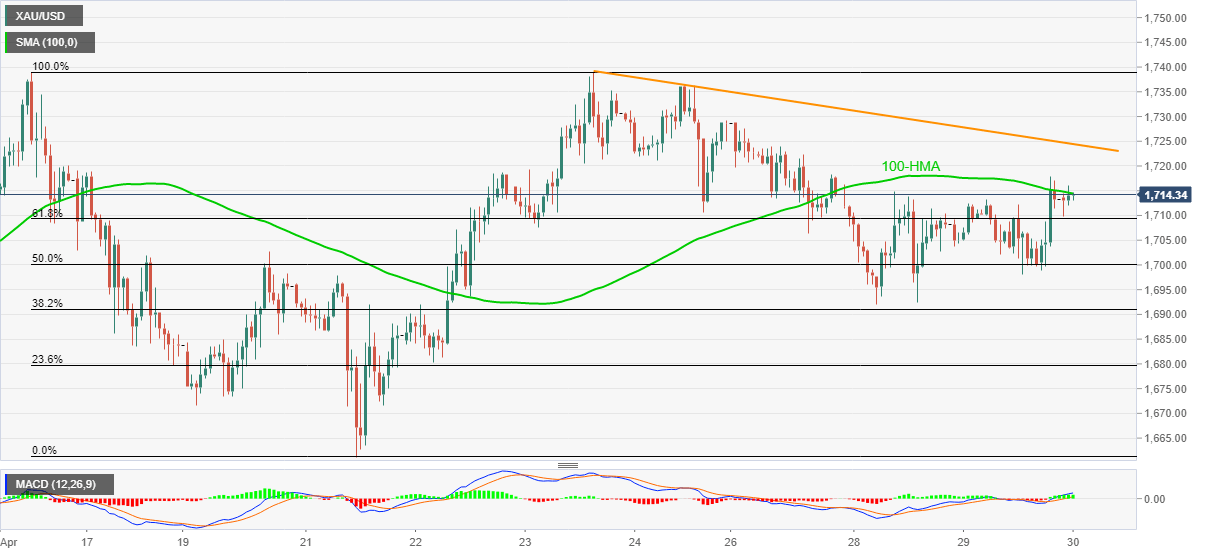
Gold prices, currently around $1,714, fail to remain strong after snapping the three-day losing streak the previous day. The reason could be the bullion’s confrontations to the 100-HMA during Thursday’s Asian session.
Even so, the precious metal stays above 61.8% Fibonacci retracement level of it April 16-21 fall, which in turn pleases the buyers.
However, a sustained break of $1,714.50 level, comprising 100-HMA, will have to cross the weekly resistance line, near $1,725 before aiming $1,733.00.
In a case the commodity manages to stay strong beyond $1,733, it’s run-up to challenge the multi-year high surrounding $1,748 can’t be ruled out.
On the contrary, a downside break below 61.8% Fibonacci retracement level of $1,709 could take rest on a $1,700 mark, also encompassing 50% Fibonacci retracement.
If at all there prevails a further decline below $1,700, $1,690 holds the gate for the metal’s drop towards the previous week low near $1,661.
Gold hourly chart
Trend: Pullback expected
