- USD/CAD bounces off the two-week low.
- A sustained break below the seven-week-old trend line keeps bears diverted towards mid-month bottom.
- 61.8% Fibonacci retracement adds to the support.
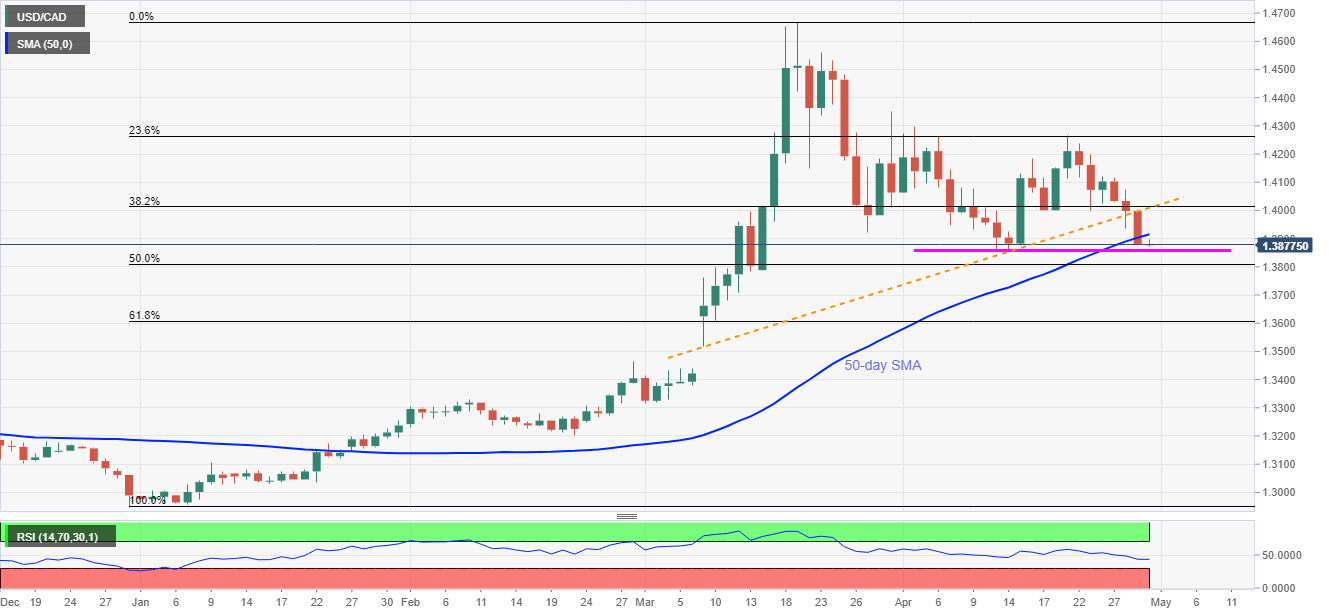
USD/CAD nears two-week low, currently around 1.3878, during the pre-European session on Thursday. In doing so, the pair carries the breakdown of a short-term ascending trend line and 50-day SMA.
As a result, sellers are targeting the mid-month low near 1.3860 during the further downside ahead of 50% Fibonacci retracement of its run-up from December 31, 2019 to March 19, 2020, at 1.3810.
In a case where the bears remain dominant past-1.3810, 61.8% Fibonacci retracement level near 1.3600 will pop-up on the sellers’ radar.
Alternatively, a daily closing beyond 50-day SMA level of 1.3915 enables it to confront the 1.4005/15 resistance confluence including support-turned-resistance line and 38.2% Fibonacci retracement.
If at all buyers manage to cross 1.4015 on a daily closing basis, they will again head for 23.6% Fibonacci retracement near 1.4265.
USD/CAD daily chart
Trend: Bearish
