Monthly Chart: Reversing the 2020 decline
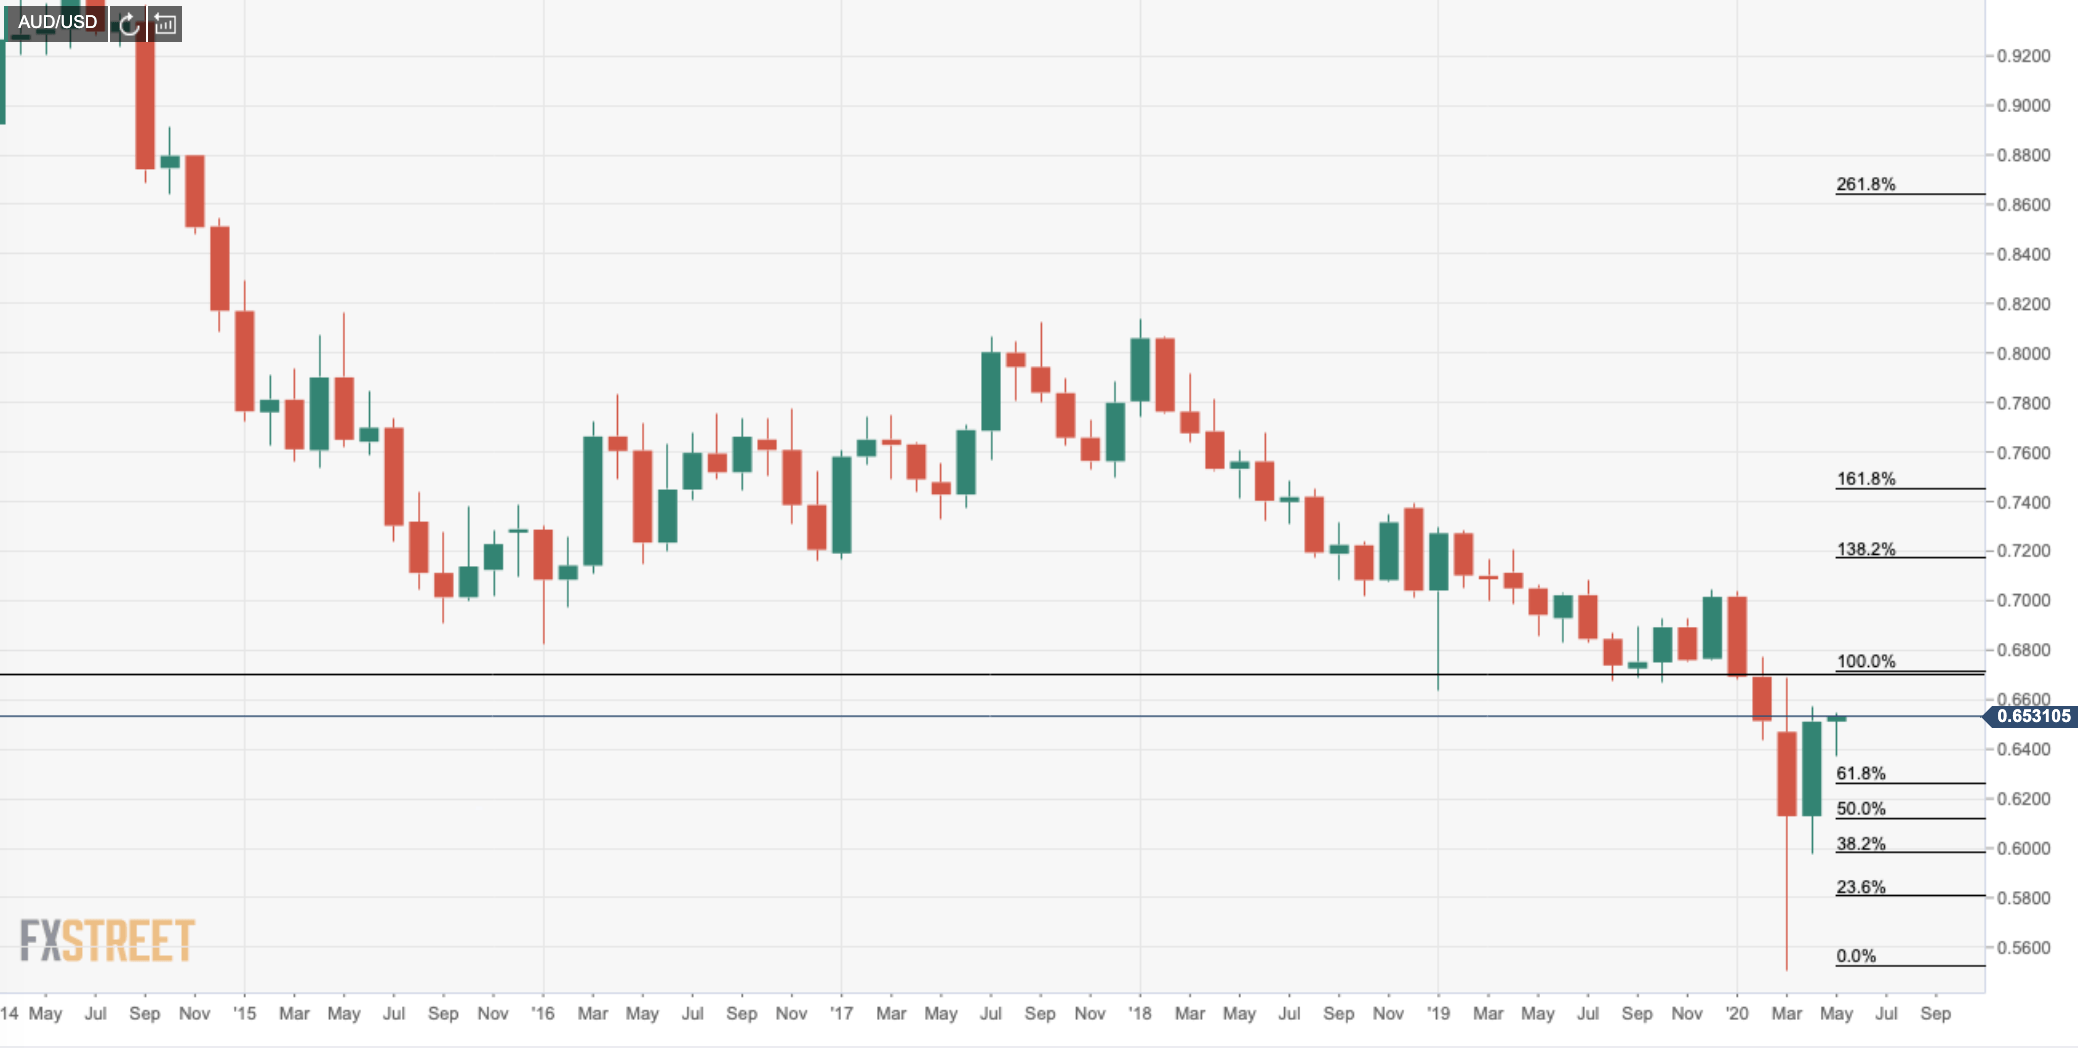
In the longer-term time frame, we can see price is recovering from the 2020 decline and is set for 100% recovery having exceded a 61.8% Fibonacci retracement already.
Daily Chart: Bulls pulling away from key support, targeting 0.67 handle
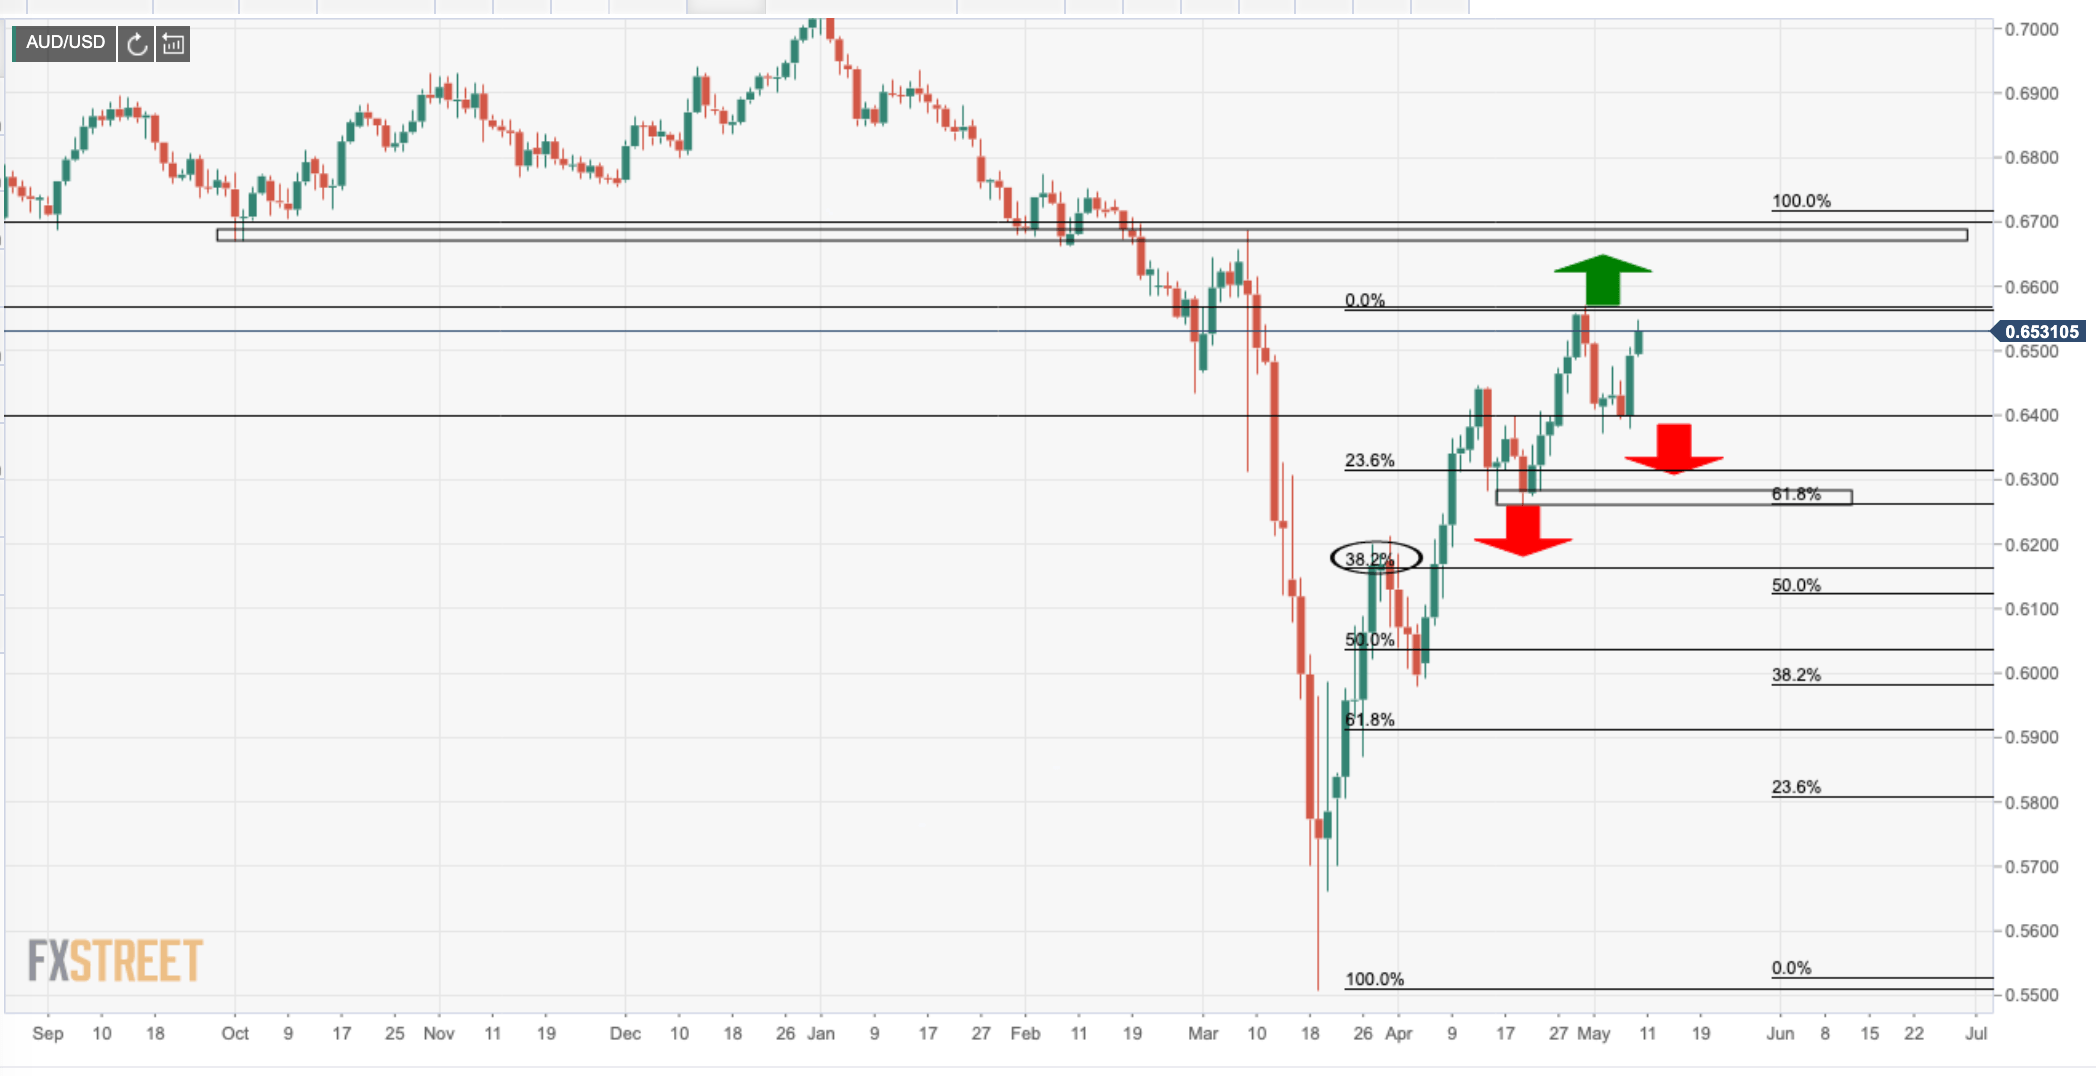
In the daily chart, the price is entering a fresh impulse to the upside and moving away from a critical support structure. Bulls have the Oct and Feb prior support as a bullish target to complete a 100% Fibonacci retracement of the Feb decline.
4-HR Chart: Bulls above the 21 and 50 moving averages
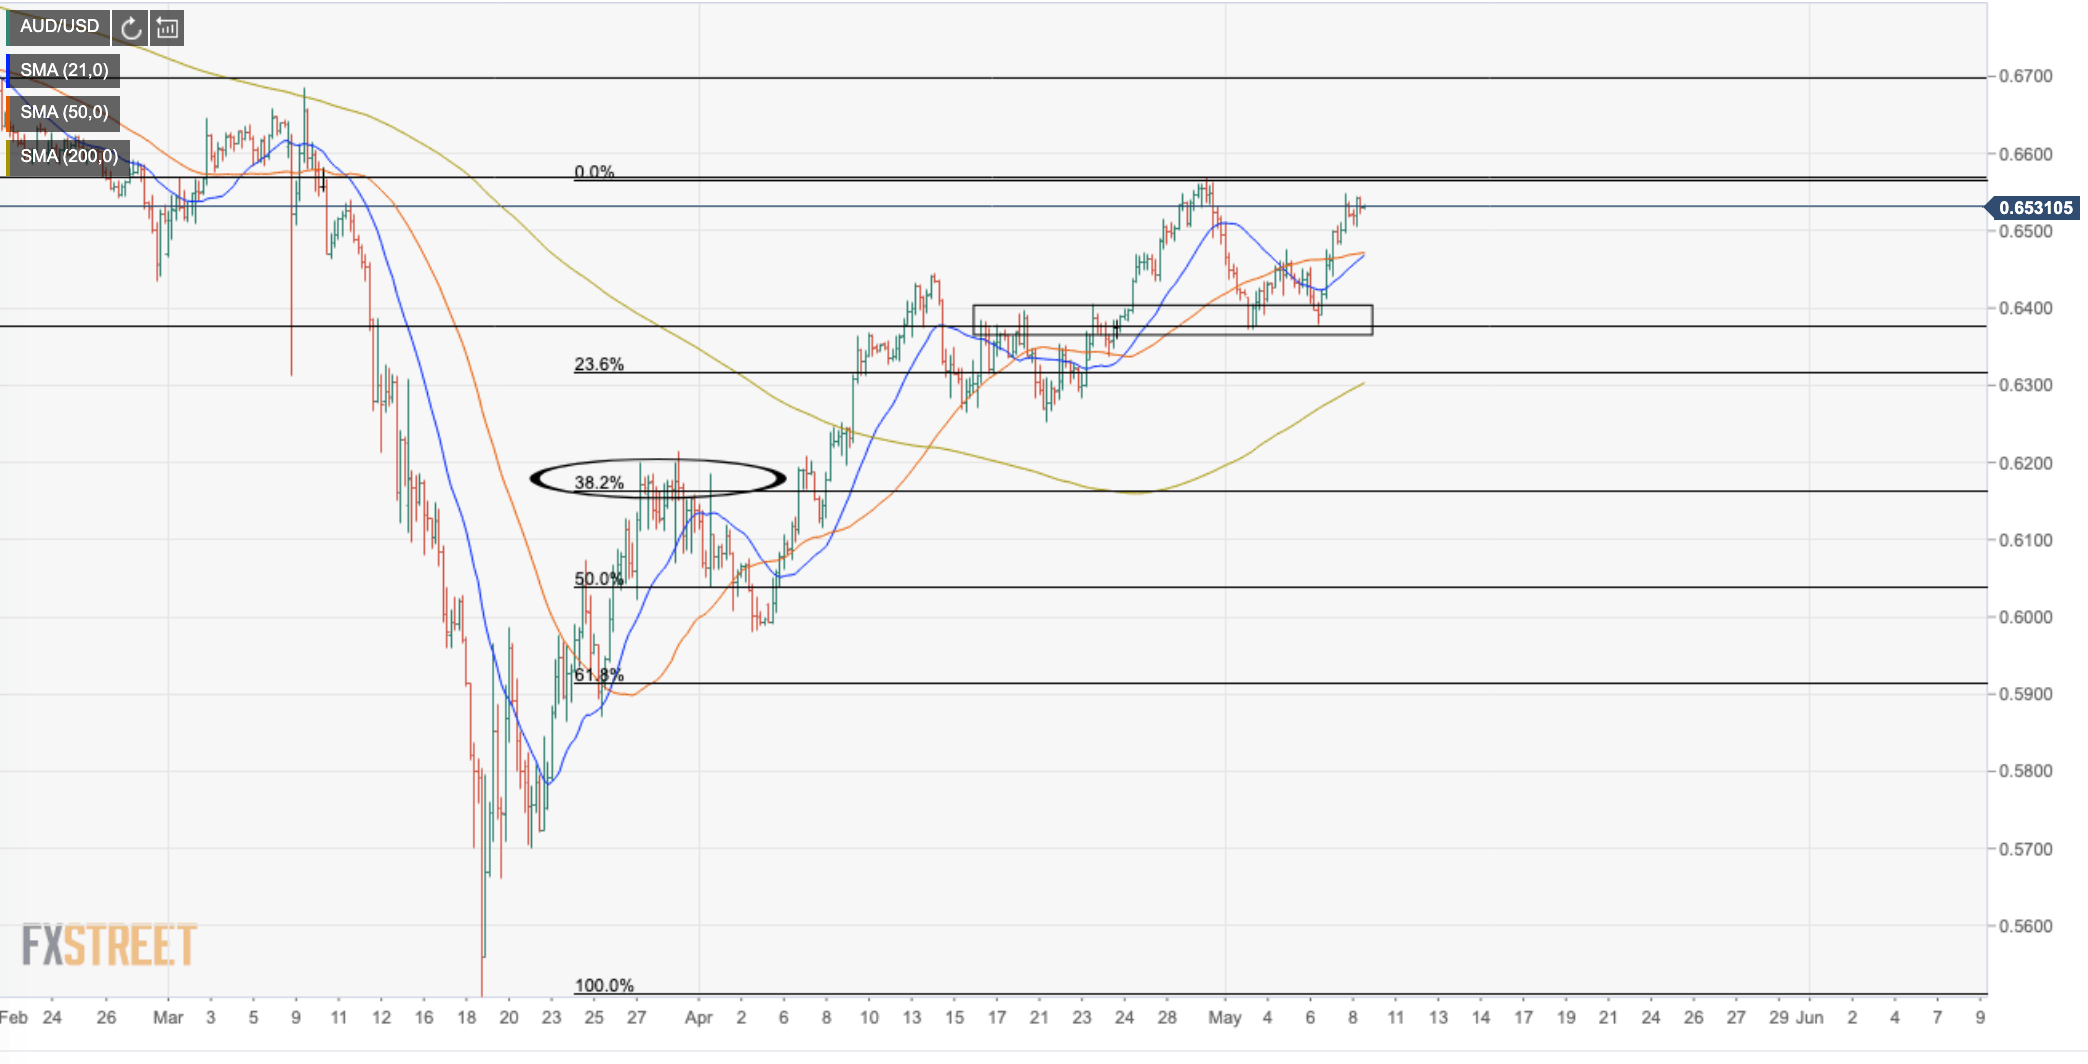
In the 4-HR chart, as the pair is attempting a break of the prior highs, in a fresh impulse, we can now clearly mark up the support structure which AUD has held. Bullishly, the pair is also above the 21 and 50 4-hour moving averages.
