- USD/MXN steps back from four-day top amid bearish MACD.
- 50-day SMA, multi-day-old rising trend line offers key support.
- Another descending resistance line from early-April adds to the resistance.
USD/MXN declines to 24.33 during Wednesday’s Asian session. In doing so, the quote takes U-turn from multi-day-old falling trend line resistance
In addition to the pair’s failure to cross the near-term key resistance line, bearish MACD also favors sellers.
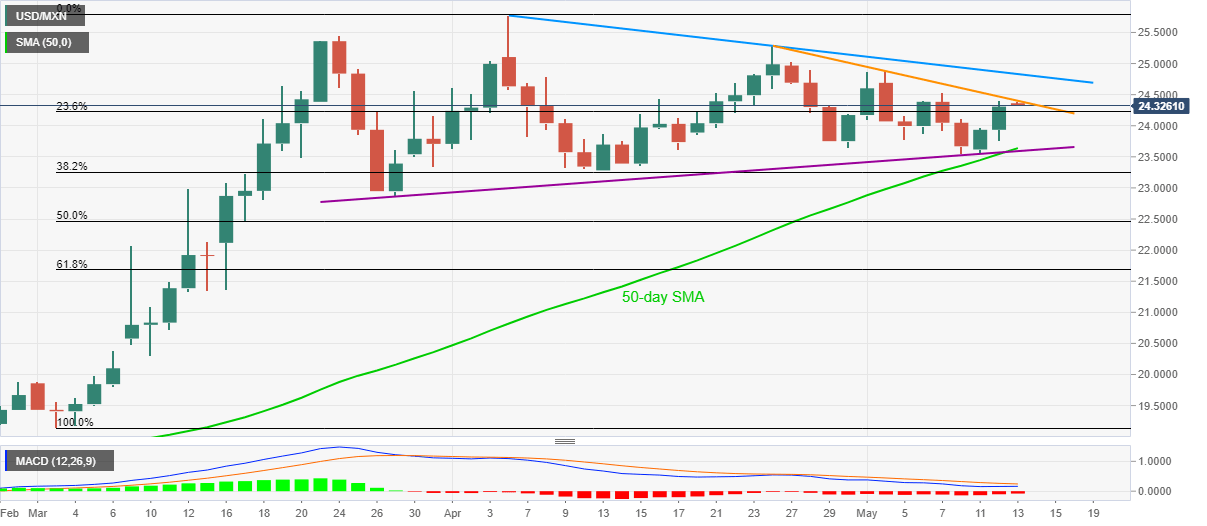
As a result, the quote’s pullback towards the 24.00 round-figure can’t be ruled out. However, a confluence of 50-day SMA and an ascending trend line from March 27, around 23.65/60, offers a strong challenge to the sellers afterward.
Alternatively, an upside clearance of 24.40 immediate resistance can propel USD/MXN prices towards another resistance line stretched from April 06, at 24.83 now.
USD/MXN daily chart
Trend: Pullback expected
