- S&P 500 bullish recovery from mid-March remains intact.
- The level to beat for bulls is the 2900 resistance.
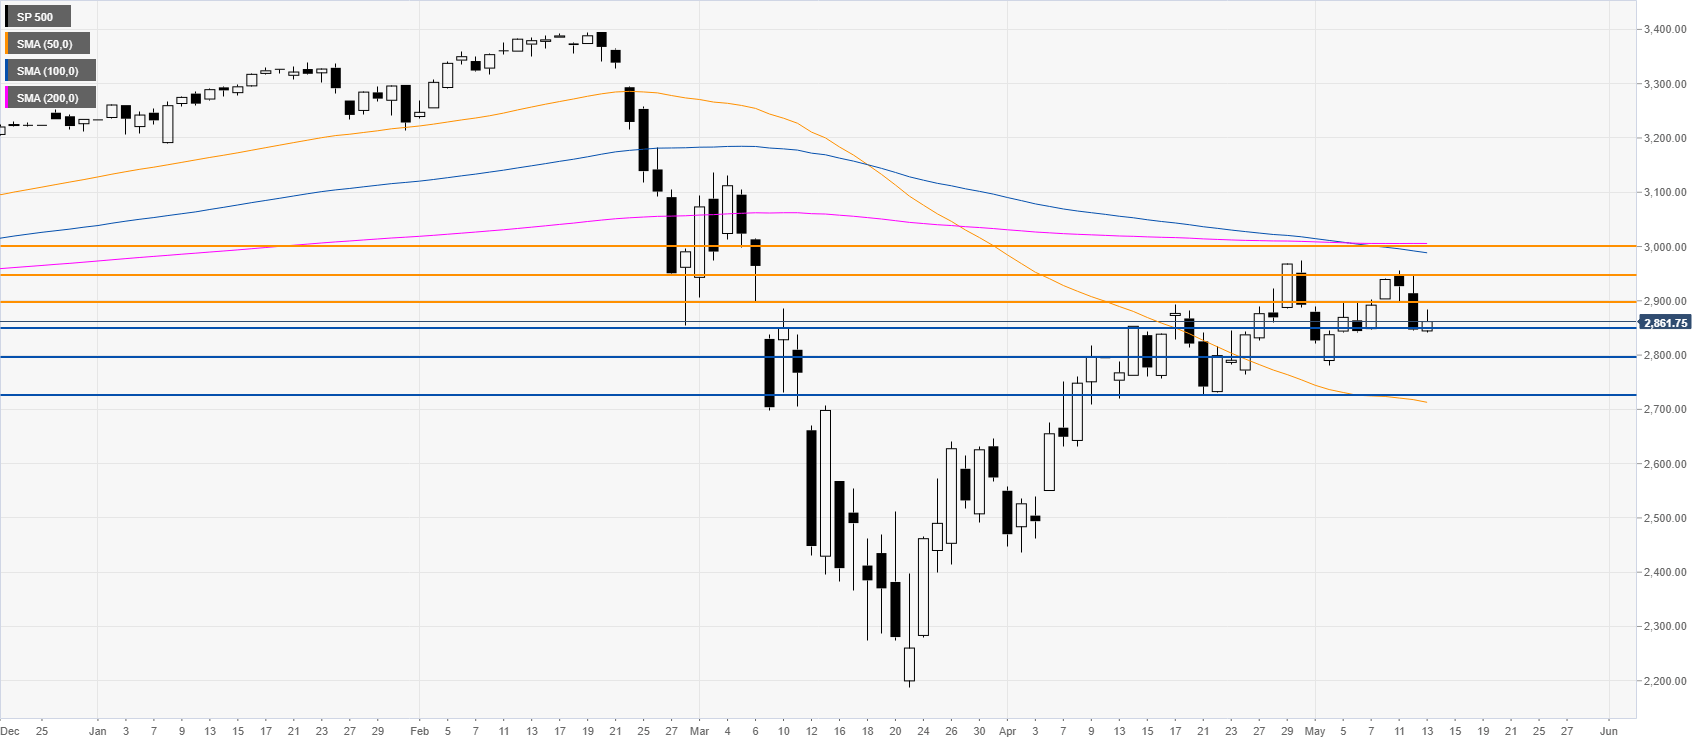
S&P 500 daily chart
Following the February-March crash, the S&P 500 has been moving in a strong bullish recovery. The market consolidates the advance while holding above the 2855 support and the 50 SMA on the daily chart. Bulls are still firmly in control as the S&P 500 is making higher highs and lows. Buyers will be looking to regains the 2900 resistance en route towards the 2950 level and the 3000 round figure close to the 100 and 200 SMAs. On the flip side, support can emerge near 2855 and 2800 levels.
Additional key levels
