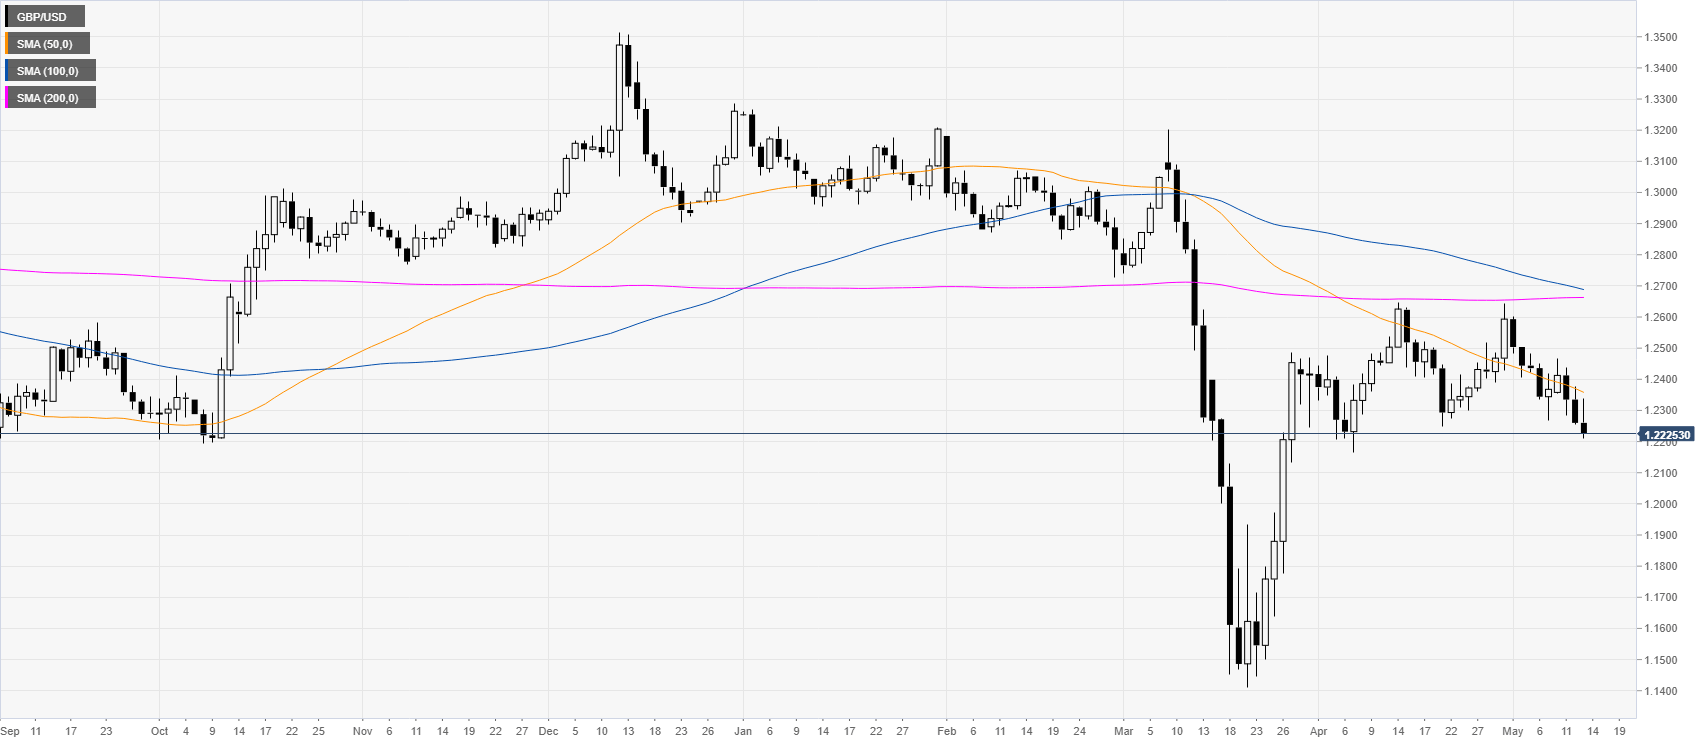
- GBP/USD is under heavy selling pressure near 5-week lows.
- The level to beat for sellers is the 1.2200 figure.
GBP/USD daily chart
GBP/USD is trading below its main SMAs on the daily chart suggesting a bearish bias as the market is under selling pressure in 5-week lows.
GBP/USD four-hour chart
GBP/USD is declining below the main SMAs on the four-hour chart as the bears are nearing the 1.2200 figure. As bears remain in control GBP/USD is seen continuing declining and reach the 1.2100 and 1.1950 levels in the medium-term. Occasional bullish attempts should find resistance near 1.2300 and 1.2400 levels.
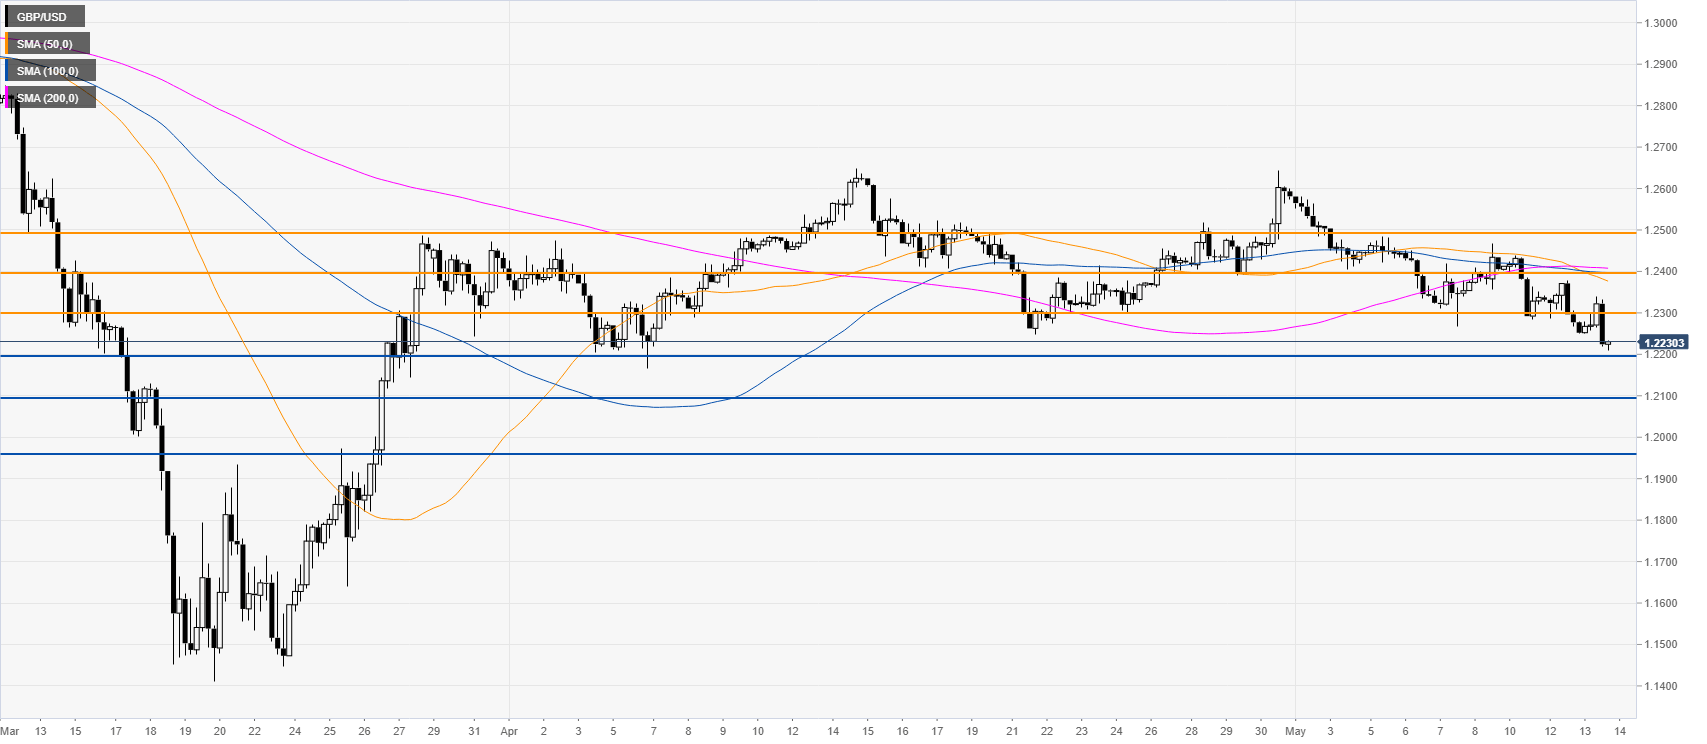
Resistance: 1.2300, 1.2400, 1.2500
Support: 1.2200, 1.2100, 1.1950
Additional key levels
 Share
Share