- USD/CAD registers another failure to break 50% of Fibonacci retracement, slips below 100-day SMA.
- A falling trend line from late-March, 61.8% Fibonacci retracement and 200-day SMA on the bears’ radar.
- April month low adds to the upside barrier above 1.3810.
USD/CAD drops to 1.3720, down 0.45% on a day, amid the Asian session on Monday. In doing so, the Loonie pair slips below 100-day SMA to visit the lowest level since March 12.
While the pair’s further selling is dependent on its daily closing below 100-day SMA, at 1.3725 now, an upward sloping trend line from January 07, currently around 1.3710, adds to the support.
In a case where the bears dominate past-1.3710, a descending trend line from March 27 at 1.3652 could please the bears.
It should also be noted that the pair’s additional weakness below 1.3652 might not refrain from challenging 61.8% Fibonacci retracement level of December 31, 2019 to March 19 upside, at 1.3606, ahead of aiming for 200-day SMA level of 1.3460.
Alternatively, a daily closing beyond 50% of Fibonacci retracement, near 1.3810, could challenge April month low of 1.3851.
USD/CAD daily chart
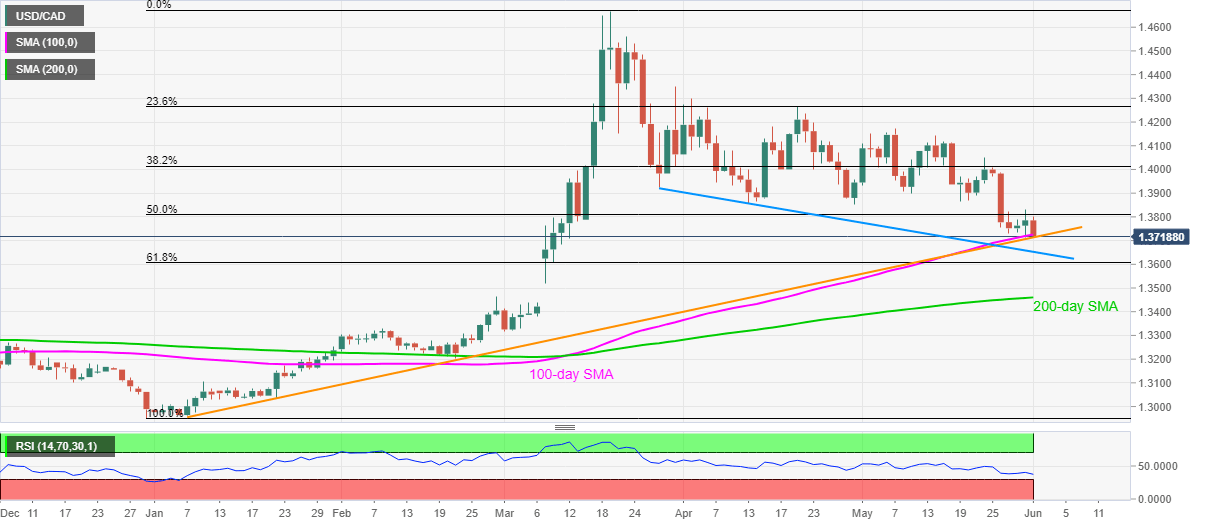
Trend: Bearish
