- USD/ZAR refreshes the 11-week low, to 17.05, after breaking over a four-month-old rising trend line.
- 100-day SMA, 50% Fibonacci retracement of the bears’ radars.
- Support-turned-resistance line, 10-day SMA guard immediate upside in a case of pullback.
USD/ZAR prints three-day losing streak while declining to 17.10, the lowest since March 19, during the early Wednesday.
The pair broke an ascending trend line from January 24 on Tuesday, which together with bearish MACD favors the pair’s further downside to a 100-day SMA level of 16.85.
Should the bears keep the reins below 16.85, 50% Fibonacci retracement of January-April upside, at 16.63, could return to the charts.
Meanwhile, an upside clearance of the support-turned-resistance, at 17.33 now, will need validation from a 10-day SMA level of 17.43 to aim for the late-May top near 17.70.
During the quote’s further recovery past-17.70, April 30 low of 18.01, will be on the bulls’ radars.
USD/ZAR daily chart
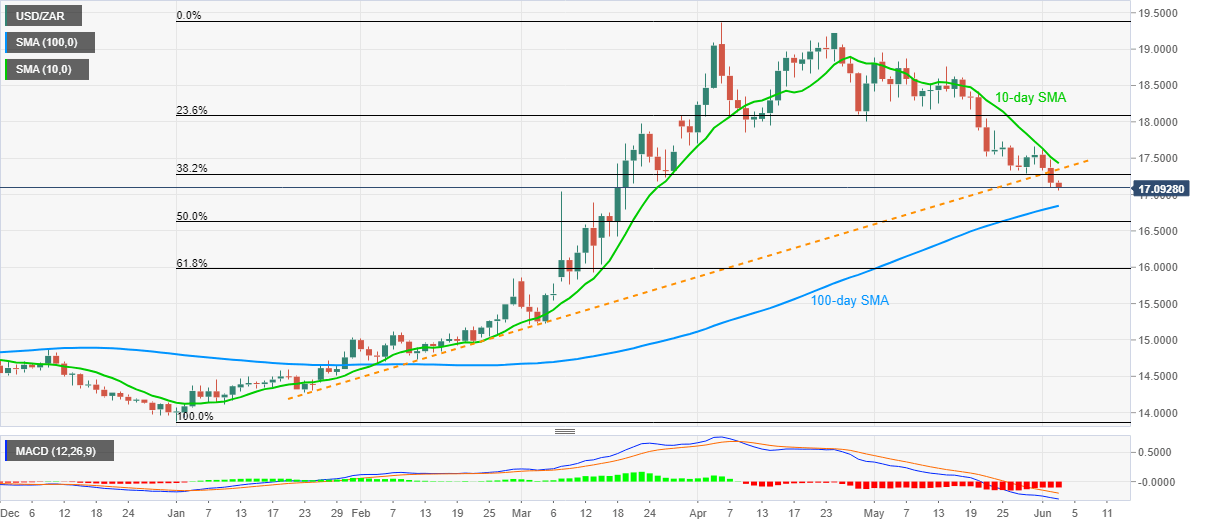
Trend: Bearish
