- USD/INDR picks up the bids from 75.39 inside two-month-old falling triangle.
- Triangle’s support is now on the sellers’ radar.
- May month top adds to the upside barriers beyond the bullish technical formation.
USD/INR seems to regain the bids while flashing 75.48 as the quote during the pre-European session on Friday. Even so, the quote stays below 10-day SMA inside a short-term falling triangle formation.
As a result, the pair’s current rise might falter around a 10-day SMA level of 75.57, a break of which could challenge the triangle pattern’s resistance line, at 75.94.
Should there be a clear break above 75.94, the bullish formation gets confirmed, but May month high of 76.20 needs to validate the pair’s run-up towards 77.00.
On the downside, lows marked during April and the current month around 75.00-74.95 can keep the pair’s immediate declines restricted.
If at all the bears dominate past-74.95, 74.60 and March 11 low near 73.59 could please them.
USD/INR daily chart
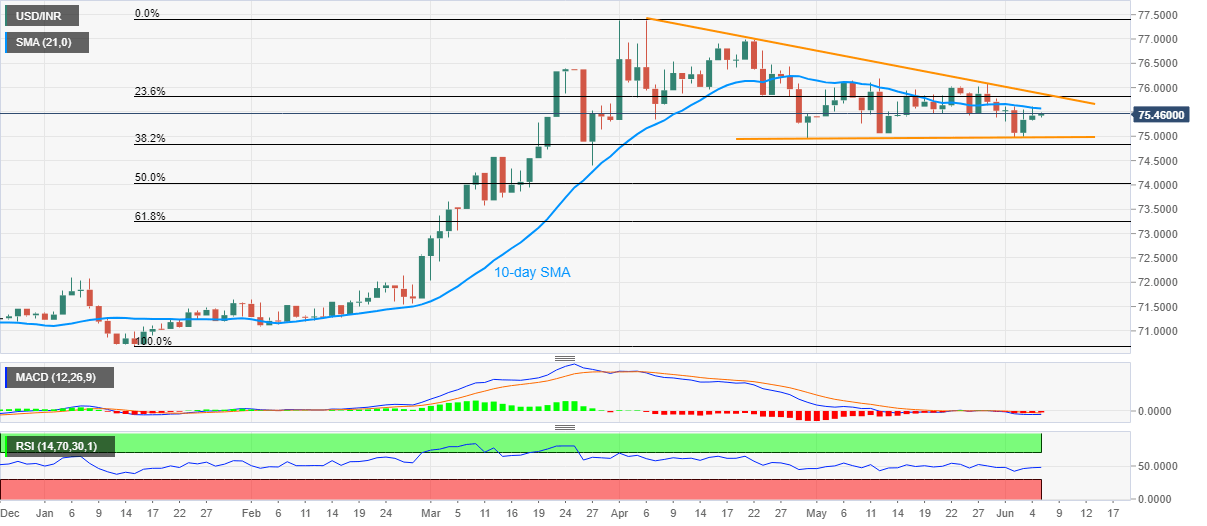
Trend: Further downside expected
