- WTI moved to flat after finding resistance at USD 40.00 per barrel.
- The move lower comes despite OPEC+ members promising compliance.
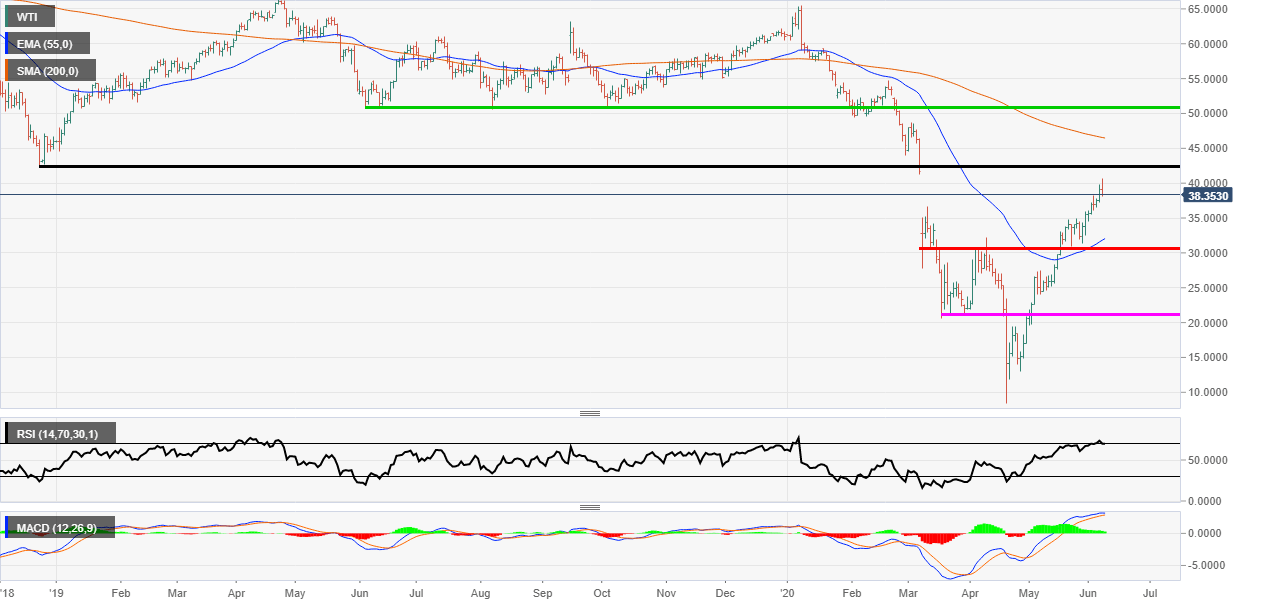
Spot WTI daily chart
WTI seems to have subscribed to the “buy the rumour sell the fact trade” as the market rejected USD 40.00 per barrel today. The latest comments from Iraq states the nation is fully committed to the cuts for the next two months. The market has now fully priced in the OPEC compliance news it seems.
Looking at the chart, the price has bounce off the psychological zone and now may be headed to support zones. On the daily chart, the next major zone is USD 30.55 per barrel but there is a gap level at USD 36.64 per barrel.
Spot WTI 4-hour chart
The 4-hour chart shows that if the price continues to sell off the orange trendline will need to be taken out. The next support could be the blue horizontal line at the wave high at USD 34.74 per barrel. Below that there is a stronger zone at the red line close to but just above the USD 30 per barrel psychological zone.
The indicators already look like they are turning over as the MACD histogram has turned red. The Relative Strength Index has moved below the 70 zone and could be headed to the 50 mid-line. The medium-term trend is still firmly higher and these level could be where the buyers step back in.
-637272482562073471.png)
Additional levels
