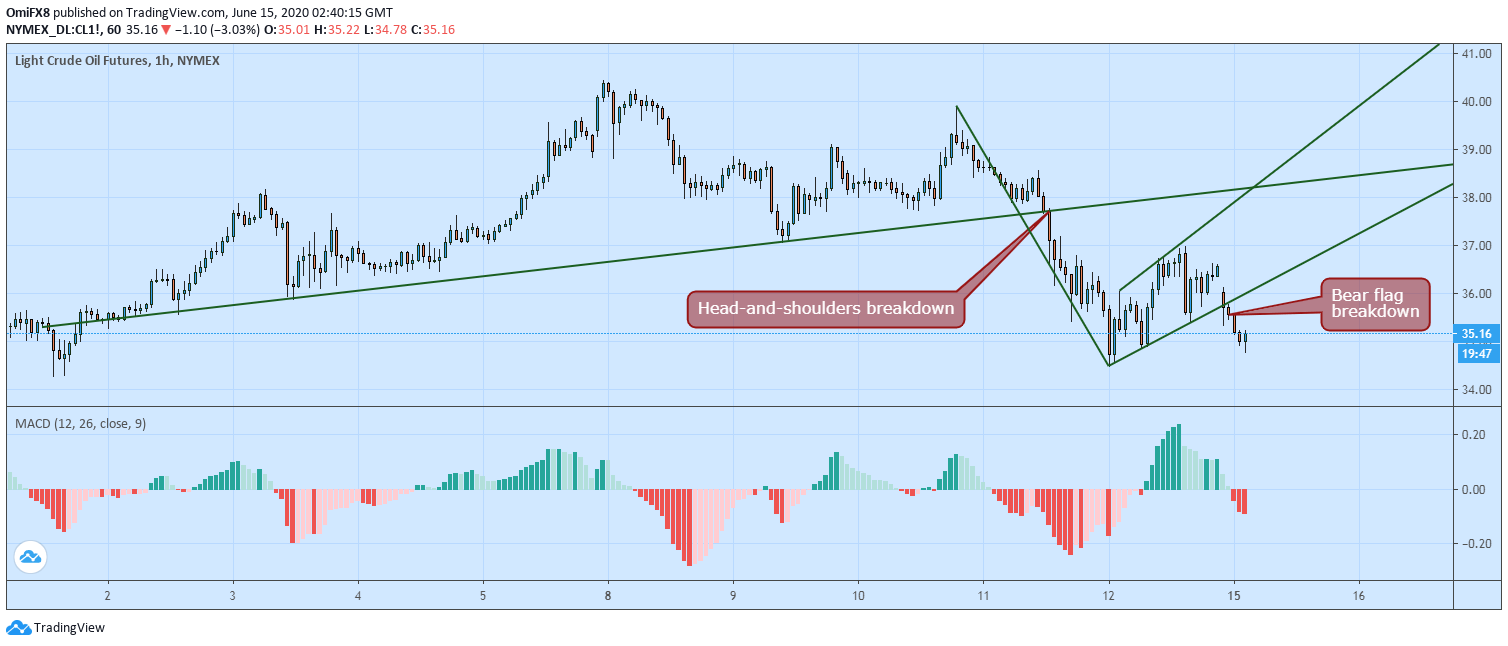
- WTI fell below $35 as suggested by Thursday’s head-and-shoulders breakdown.
- The black gold may suffer deeper losses as the hourly chart now shows a bear flag breakdown.
West Texas Intermediate (WTI) crude is trading near $35.16 per barrel at press time, representing a 3% decline on the day.
Oil fell by 8.3% last week, ending the six-week winning trend and confirming a head-and-shoulders or a bearish reversal pattern on the hourly chart. The breakdown confirmed on June 11 created a room for a sell-off to $34.96. That level was put to test and breached on Friday, as prices hit a low of $34.48.
While WTI has bounced up from the session low of $34.78, the bias still remains negative, as the hourly chart shows a bear flag breakdown, a bearish continuation pattern.
The breakdown confirmed during the early Asian trading hours has opened the doors to $30.33 (target as per the measured move method). The bear flag breakdown would be invalidated if prices rise above $36.00.
That looks unlikely, as the hourly chart MACD histogram is reporting a strengthening of the downward momentum with deeper bars below the zero line.
Hourly chart
Trend: Bearish
Technical levels
