- USD/IDR retreats from an eight-day top to defy Friday’s recovery moves.
- One-week-old support line gains immediate attention of sellers.
- Buyers will have additional upside barrier in the form of two-month-long falling trend line.
USD/IDR drops to 14,053, down 0.62% on a day, while heading into the European open on Monday. In doing so, the pair takes a U-turn from 10-day EMA, which in turn drags it towards a short-term support line.
However, the pair’s further downside past-13,986 support line could be questioned by the oversold RSI conditions.
As a result, the quote’s current weakness seems to have a limited downside till 13,986, which if broken could recall the early-February month top near 13,775 on the chart.
On the contrary, a daily closing beyond 10-day EMA level around 14,140 isn’t going to lure the buyers as a downward sloping trend line from April 06, at 14,213 now, stands tall to probe further upside.
If at all the bulls manage to offer a clear break above 14,213, may month low near 14,675 and 50-day EMA around 14,695 could return to the charts.
USD/IDR daily chart
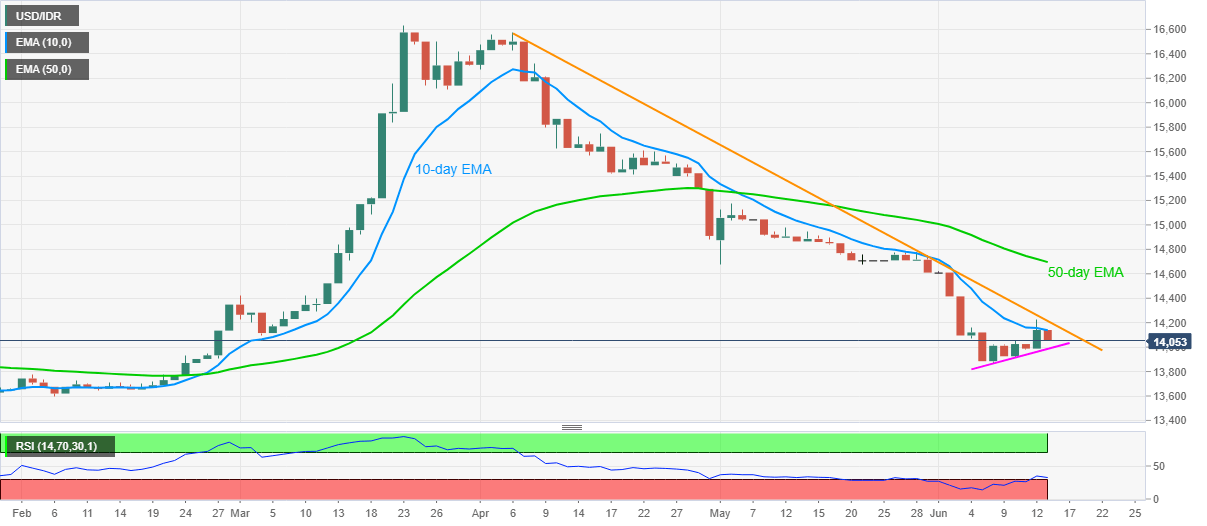
Trend: Pullback expected
