- GBP/JPY eases from 135.90 while flashing mild gains.
- Monthly ascending trend line, 50% Fibonacci retracement offers immediate support.
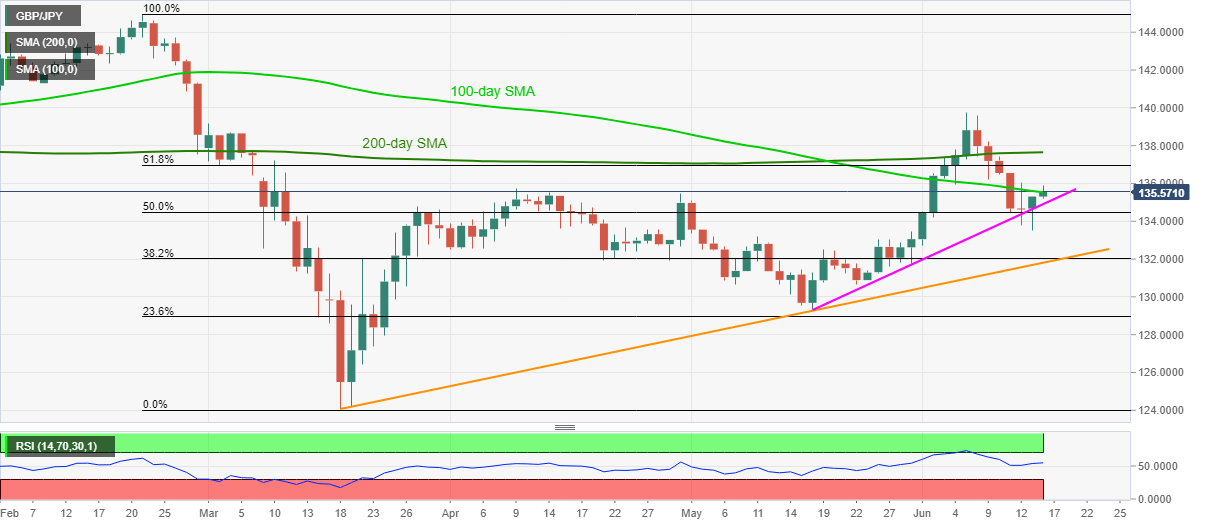
- 61.8% Fibonacci retracement, 200-day SMA offer additional resistances.
GBP/JPY steps back from a two-day top while declining to 135.47 during the initial Tokyo trading hours on Tuesday. However, the pair still prints 0.13% gains on a day while fading the upside momentum near 100-day SMA. Other than the failures to cross the key SMA, traders’ wait for the Bank of Japan’s (BOJ) monetary policy decision also exerts downside pressure on the pair.
As a result, an upward sloping trend line from May 18, at 134.90 now, could offer immediate support to the pair during its further downside. Though, 50% Fibonacci retracement of February-March fall, at 134.50, followed by Monday’s low near 133.50, could challenge the bears afterward.
In a case where the GBP/JPY prices decline below 133.50, a confluence of 38.2% Fibonacci retracement and a support line from March 18 near 132.00 will be the key to watch.
Alternatively, 136.00 and 61.8% Fibonacci retracement level around 137.00 holds the doors for the pair’s further rise towards a 200-day SMA level of 137.66.
It’s worth mentioning that the pair’s ability to cross 200-day SMA on the daily chart enables the bulls to aim for the monthly top near 139.75.
GBP/JPY daily chart
Trend: Sideways
