- USD/IDR extends losses from Friday’s top near 14,225.
- Oversold RSI conditions probe the sellers from confirming the bearish chart pattern.
- A falling trend line from early-April guards immediate upside.
USD/IDR remains on the back foot around 14,055 during the initial trading on Tuesday. While looking at the pair’s last two-week moves, the rising wedge bearish chart pattern appears on the daily chart. Though, oversold RSI conditions stop the sellers from confirming the formation.
On the contrary, an ascending trend line from April 06, at 14,161 now, can offer immediate resistance to the pair ahead of propelling it to the bearish formation’s resistance line near 14,250.
Should the quote manages to cross 14,250, buyers can aim for the monthly high above 14,620 during the further upside.
Alternatively, a downside break below 14,000 will asset the pair’s extended fall towards the early-February top near 13,775. During the pair’s further declines below 13,775, the yearly low close to 13,570 might lure the bears.
USD/IDR daily chart
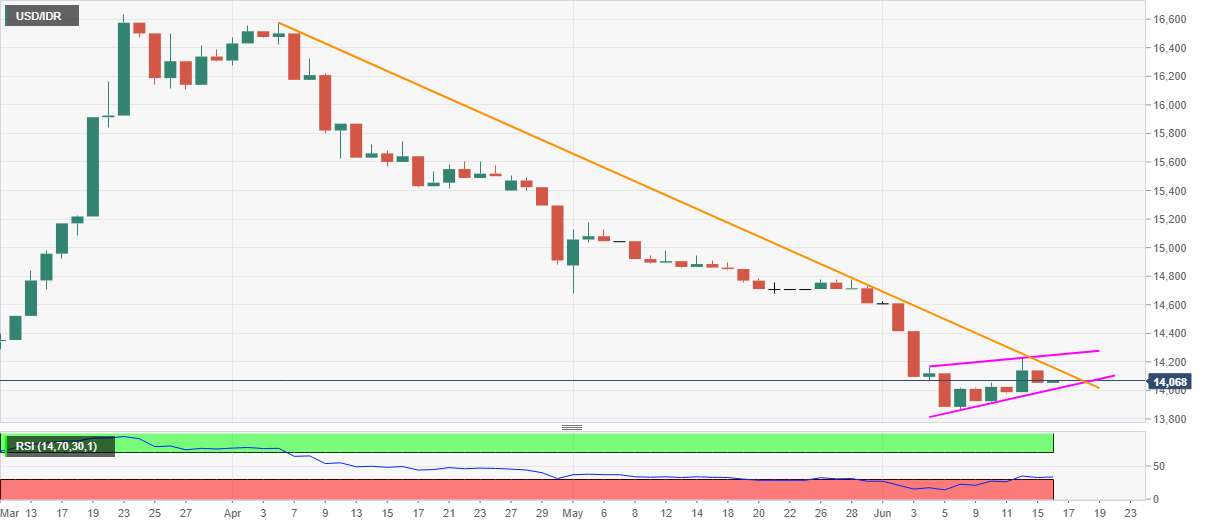
Trend: Bearish
