- WTI defies two-day winning streak while easing from $37.71.
- $36.10 might offer immediate support ahead of the monthly low.
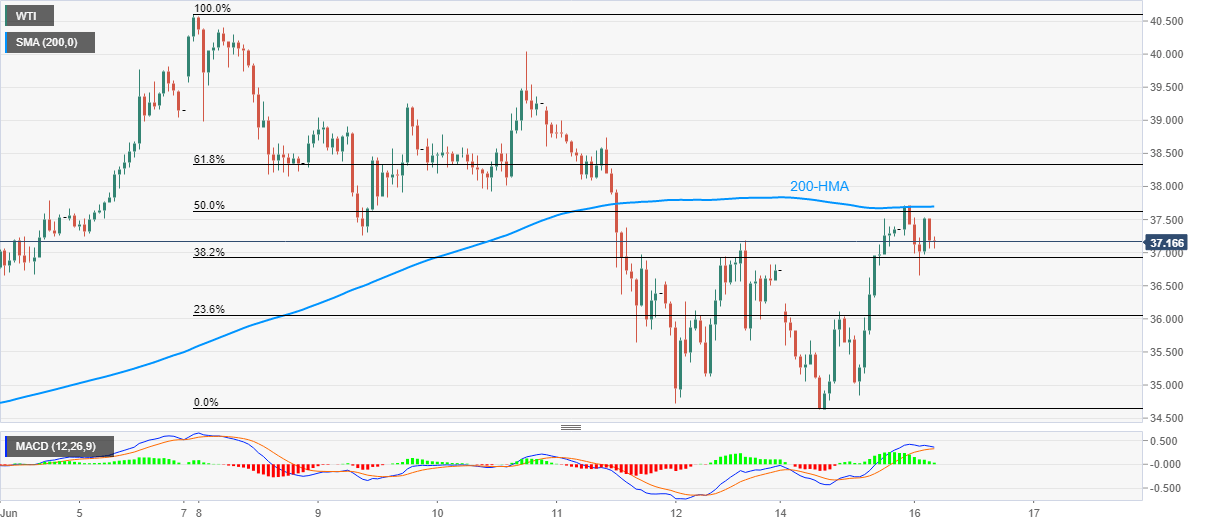
- 61.8% of Fibonacci retracement acts as additional resistance beyond 200-HMA.
WTI retreats from 200-HMA to $37.15, down 0.55% during the early Tuesday’s trading. In addition to the black gold’s failure to cross the key HMA, MACD conditions also favor odds of its further declines.
That said, the energy benchmark eyes $36.10 during additional weakness. Though, Monday’s bottom of $34.64 and the monthly low near $34.45 can restrict the quote’s extended fall.
On the flip side, a clear break above 200-HMA level of 37.70 will have to successfully cross 61.8% Fibonacci retracement level of June 07-15 downside, around $38.35 to justify the oil price strength.
In doing so, $38.70, $39.20 and $40.00 could offer consecutive halts during the extra upside.
Given the bulls’ ability to stay dominant above $40.00, the monthly high of $40.60 and the March 06 low near $41.20 could become their favorites.
WTI hourly chart
Trend: Pullback expected
