- WTI recedes from 38.74, snaps three-day winning streak.
- Friday’s high may offer immediate support ahead of 61.8% Fibonacci retracement.
- Monthly high could lure the bulls beyond short-term resistance trend line.
WTI declines to $37.82, down 0.93% on a day, amid the initial Wednesday’s trading. The black gold recently took a U-turn from the descending trend line from June 07. As a result, the sellers are likely to return on the desks.
In doing so, Friday’s high of $37.19 may become their immediate choice before targeting 61.8% Fibonacci retracement of its upside from May 22 to June 07, at $34.60.
If at all the oil prices drop below $34.60, May 27 low near $31.30 can offer an intermediate halt before recalling a $30.00 threshold on the chart.
Alternatively, an upside clearance of $39.20 could trigger the energy benchmark’s rise towards $40.00 and then challenge the monthly top surrounding $40.60.
During the quote’s additional rise past-$40.60, the early-March gap below $41.20 will be on the buyers’ radars for filling.
WTI four-hour chart
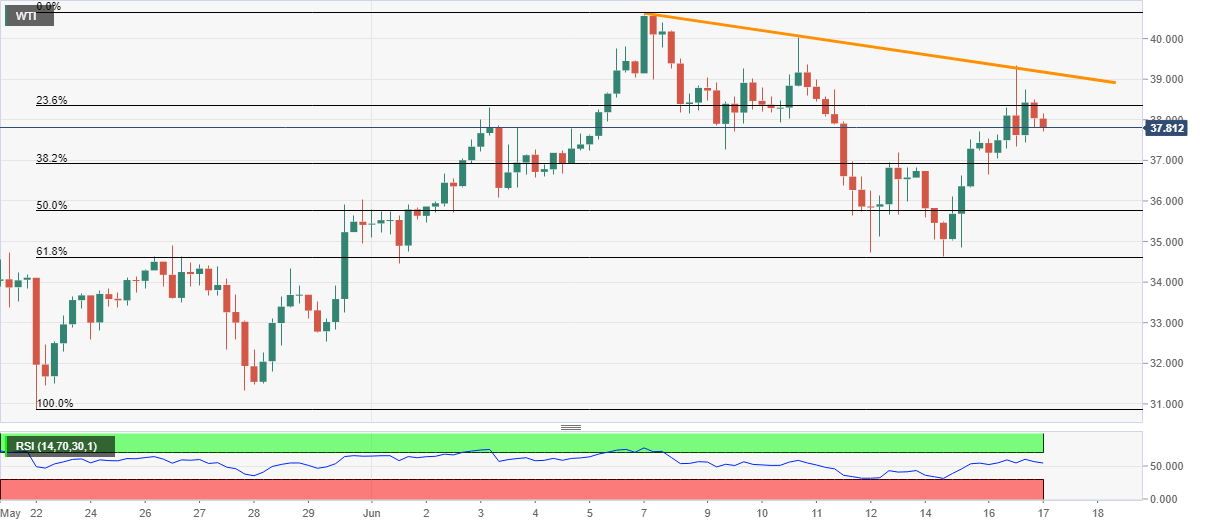
Trend: Further downside likely
