- USD/IDR stays above 10-day SMA despite easing from a two-week top.
- An ascending trend line from the early-February becomes the key support.
- Buyers will look for entries beyond 14,230 to aim for March 02/03 high.
USD/IDR seesaws around 14,182 during the early Friday’s trading. In doing so, the quote keeps the U-turn from 78.6% Fibonacci retracement of January-April rise. Though, 10-day SMA restricts the pair’s immediate downside.
Looking at the oversold RSI conditions, the pair might gradually recover the losses from late-May. However, a clear break of the key Fibonacci retracement level, at 14,230, becomes necessary for that.
During the pair’s run-up past-14,230, March 02/03 tops near 14,410 and 14,500 round-figure could offer intermediate halts before fueling the pair to 61.8% Fibonacci retracement around 14,770/65.
On the downside, a daily closing below 10-day SMA level of 14,170 could revisit a medium-term ascending trend line, at 13,980 now. Though, the quote’s additional weakness below the key support line will witness multiple rest-points starting from the monthly low near 13,935 and the early-February top of 13,710 to revisit the yearly bottom close to 13,560.
USD/IDR daily chart
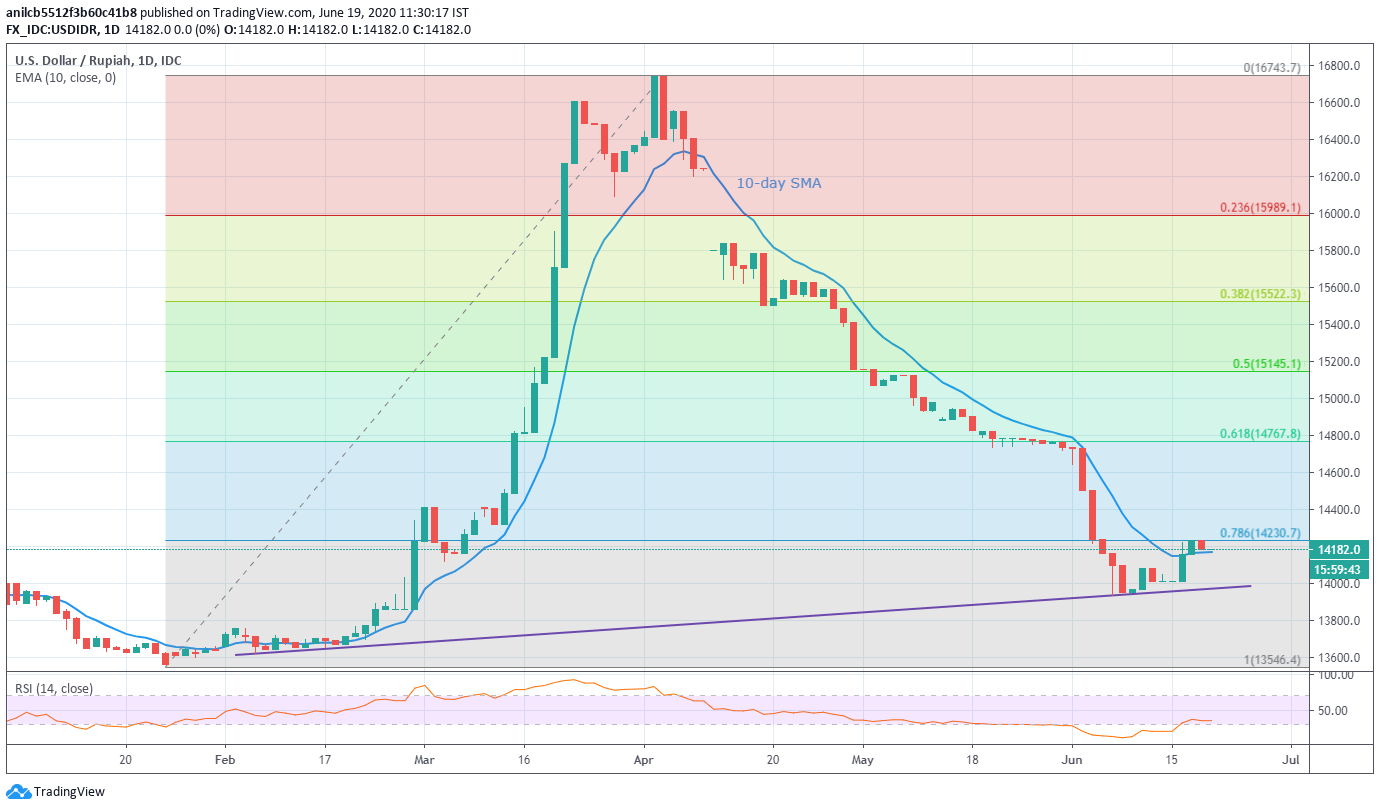
Trend: Pullback expected
