- DXY comes under pressure and approaches 97.00.
- Improved sentiment in the riskier assets weighs on the dollar.
- NFP, Initial Claims next of relevance in the calendar.
The greenback, when measured by the US Dollar Index (DXY), is trading on the defensive for yet another session on Thursday.
US Dollar Index looks to data, risk trends
The index shed further ground on Wednesday amidst the better mood in the risk-associated complex, all in response to encouraging news surrounding a potential vaccine for the coronavirus.
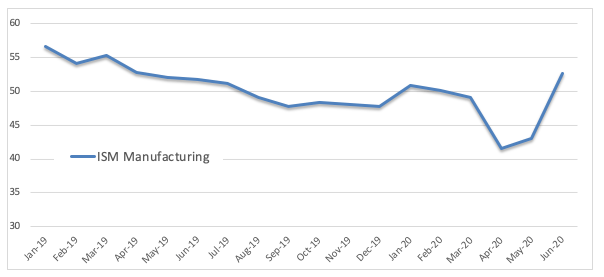
In addition, better-than-expected results from key US fundamentals have also lent extra legs to the risk-on sentiment and fuelled further the sell-off in the buck. Indeed, the always-relevant ISM Manufacturing rose to 52.6 for the month of June, in line with the recovery in the Markit’s manufacturing PMI to 49.8 for the same period and all supporting the idea of a strong economic recovery.
Later in the NA session, the US labour market will be in the centre of the debate in light of the releases of weekly Initial Claims and June’s Non-farm Payrolls along with the Unemployment Rate. In addition, Factory Orders for the month of May will also be in the pipeline.
What to look for around USD
The unremitting advance of the pandemic in the US remains in centre stage amidst efforts to keep the re-opening of the economy well in place and news surrounding potential vaccines. As always, the broad risk appetite trends emerge as the main driver for the dollar in the short-term coupled with omnipresent US-China trade effervescence. On the constructive stance around the buck, bouts of risk aversion should support the investors’ preference for the greenback as a safe haven along with its status of global reserve currency and store of value. Playing against this, the ongoing (and potentially extra) stimulus packages by the Federal Reserve could limit the dollar’s upside.
US Dollar Index relevant levels
At the moment, the index is losing 0.10% at 97.05 and faces the next contention at 96.39 (weekly low Jun.23) seconded by 96.03 (50% Fibo of the 2017-2018 drop) and finally 95.72 (monthly low Jun.10). On the other hand, a break above 97.80 (weekly high Jun.30) would aim for 97.87 (61.8% Fibo of the 2017-2018 drop) and finally 98.33 (200-day SMA).
