- WTI seesaws in a choppy range between $41.14 and $41.29 following its pullback from three-week high.
- Repeated failures to cross June month high, bearish chart formation signal buyers’ exhaustion.
- $40.90/85 area, 200-HMA adds to the downside support.
Having surged to the three-week high the previous day, WTI trades near $41.20 during Thursday’s Asian session. The black gold has been making rounds to $41.14/29 since the late-US session. However, a bearish chart formation on the hourly play suggests underlying momentum weakness.
While a downside break of $40.75 will confirm the rising wedge bearish pattern, a 200-HMA level of $40.40 and $40.00 round-figures can act as validation points for the quote’s further weakness.
During the energy benchmark’s further weakness past-$40.00, the monthly low of $38.73 will pop-up on the sellers’ radars.
Meanwhile, the said formation’s resistance near $41.55 and June month’s high around $41.65 holds the key to the commodity’s further upside towards February month bottom near $44.00.
WTI hourly chart
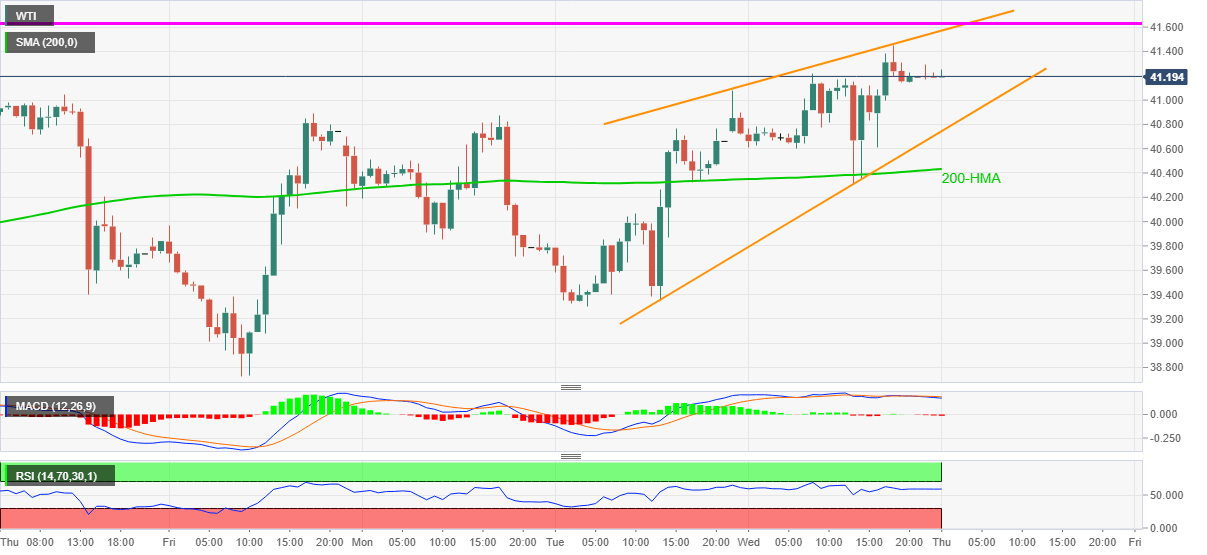
Trend: Pullback expected
