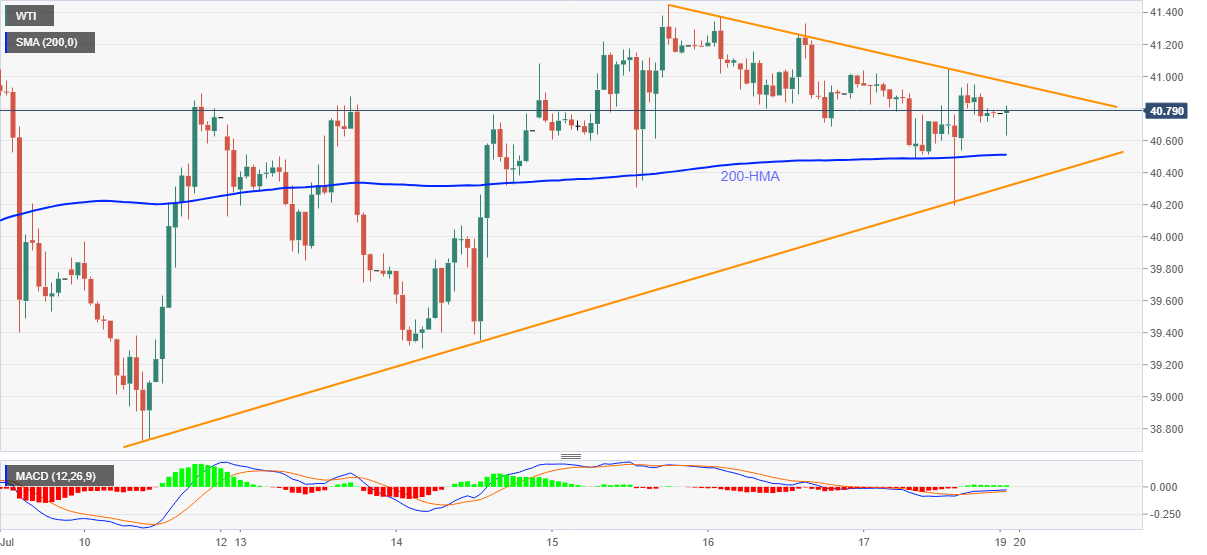
- WTI extends the late-Friday pullback from $40.95 below three-day-old resistance line.
- 200-HMA offers immediate support, an ascending trend line from July 10 becomes the key.
- Bulls will have a bumpy road above $41.00.
WTI remains depressed around $40.80 during the early Asian session on Monday. The black gold prints three-day losing streak while staying inside a short-term triangle formation.
Considering the energy benchmark’s latest pullback from the formation resistance, its drop to 200-HMA level of intermediate support, near $40.50, can’t be ruled out. However, a week-long rising support line, at $40.30 now, precedes $40.00 to restrict the bears’ entry.
Should the quote slip below $40.00, July 14 low near $39.30 and the monthly bottom surrounding close to $38.70 will be in the spotlight.
Meanwhile, an upside clearance of $41.00 immediate resistance could push the bulls to challenge July 15 top near $41.45 ahead of the June month’s peak adjacent to $41.65.
In a case where the buyers manage to cross $41.65 on a daily closing basis, February month low around $44.00 should be on their radars.
WTI hourly chart
Trend: Sideways
