- WTI portrays the second-day losses following Thursday’s Bearish spinning top.
- A five-week-old ascending trend line, 21-day EMA offers immediate support.
- 200-day EMA adds a filter to the upside past-$41.65.
WTI drops 0.60% to $40.52 while heading into the European session on Monday. The energy benchmark extends downside after Thursday’s candlestick formation on the daily chart suggested the bears’ return.
However, an upward sloping trend line from June 15, at $40.00 now, quickly followed by a 21-day EMA level of $39.80, restricts the black gold’s near-term declines.
If at all the bears dominate past-$39.80, the monthly bottom around $38.70 and June 25 low near $37.18 could return to the charts.
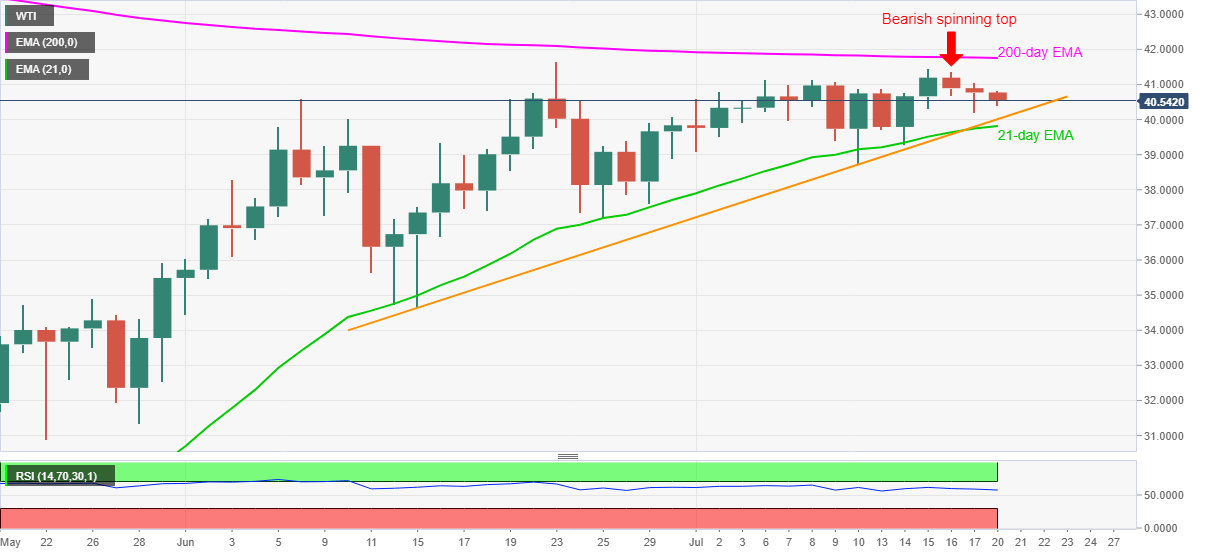
Meanwhile, $41.00 guards the oil price upside ahead of the June month’s top near $41.65. In a case where the bulls dominate past-$41.65, a 200-day EMA level of $41.75 adds to the upside barriers for the optimists before they attack February’s low near $44.00.
WTI daily chart
Trend: Further weakness expected
