- WTI fades upside momentum following its uptick to $42.04.
- MACD conditions join bearish chart pattern on the daily timeframe.
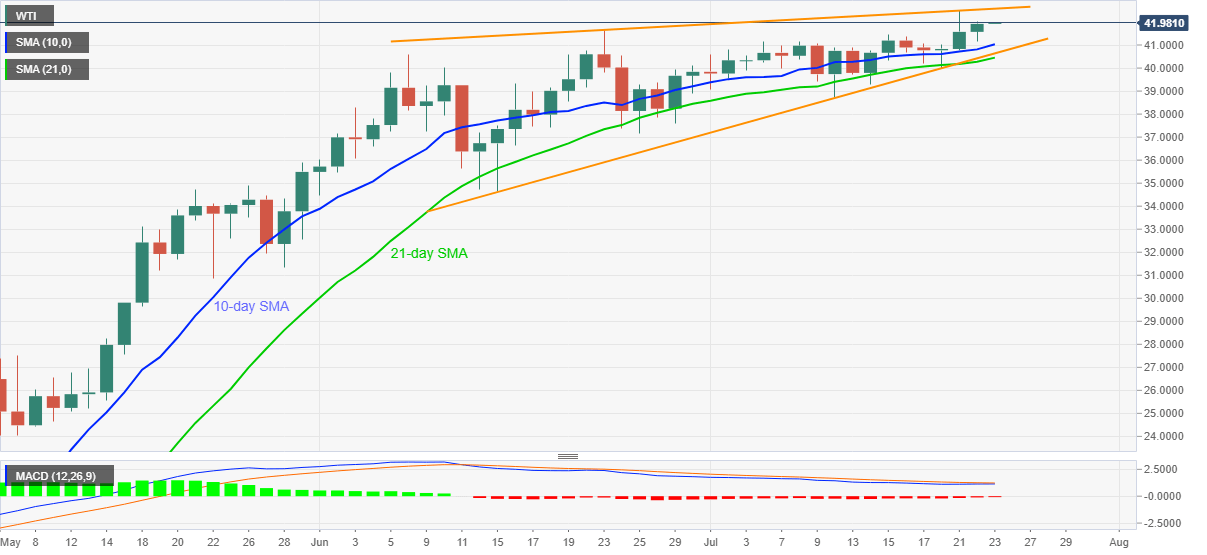
- An upside clearance of $42.60 will defy the bearish formation, 21-day SMA adds to the support.
WTI eases to $41.90 during the initial Asian session on Thursday. The energy benchmark rose to $42.04 the previous day before stepping back to $41.82. Though, the black gold’s latest weakness could be traced from its pullback from $41.98.
The moves justify the bearish MACD signals and a rising wedge play on the daily chart. As a result, buyers are likely exhausted and hence sellers should keep an eye on any downside below the said pattern’s support line.
Other than an ascending trend line since June 15, at $40.60 now, a 21-day SMA level around $40.40 and $40.00 round-figure will also be the key to follow for fresh short positions.
In doing so, the bears could target the late-May top surrounding $34.90 ahead of eying the return of $31.00. It’s worth mentioning that the 10-day SMA level of $41.03 can offer immediate support to the commodity.
Meanwhile, Tuesday’s top near $42.52 joins $42.00 to limit the quote’s nearby advances ahead of the said bearish pattern’s resistance-line, at $42.60 now.
In a case where the oil prices remain strong beyond $42.60, February month low near $44.00 could regain market attention.
WTI daily chart
Trend: Pullback expected
