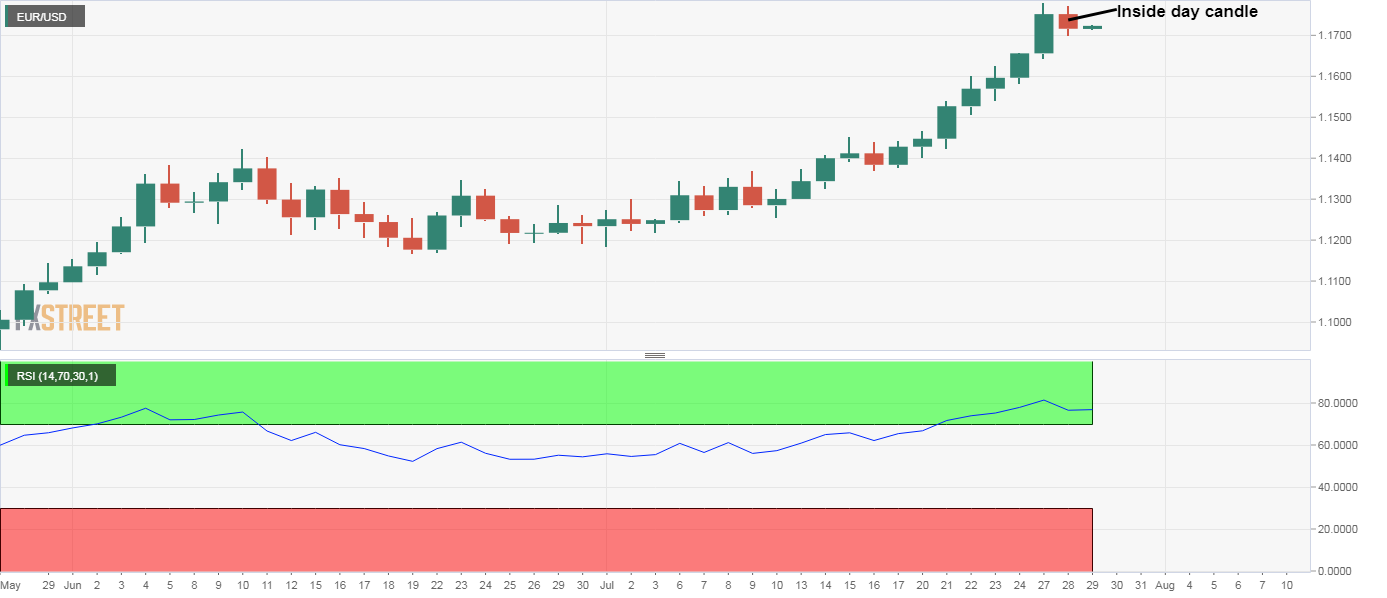
- EUR/USD’s daily chart shows a bearish inside day candle.
- The 14-day RSI shows the rally is overdone.
- The pair could witness a pullback to the ascending 10-day SMA.
EUR/USD fell by 0.31% on Tuesday, forming an inside day candle and snapping a seven-day winning trend that saw the single currency rally from 1.14 to 1.1781.
Inside day is a candlestick pattern that forms after an asset has experienced daily price ranges within the previous day’s high and low. While the pair fell by 0.31% on Tuesday, it traded well within Monday’s high and low of 1.1781 and 1.1641.
Essentially, inside day pattern represents consolidation or indecision and is considered an early warning of a trend reversal if it appears following a notable rally or sell-off. In this case, the inside has appeared at 22-month highs.
That, alongside an above-50 reading on the 14-day relative strength index, suggests a temporary top has been made. The pair could pullback to the 10-day simple moving average, currently at 1.1579. At press time, the pair is trading largely unchanged on the day near 1.1725.
Daily chart
Trend: Pullback likely
Technical levels
