- WTI keeps recovery moves from $41.68 to seesaw around the intraday high of $43.00.
- Bearish candlestick formation, monthly resistance line keeps sellers hopeful.
- Buyers have multiple upside barriers between $43.00 and $44.00.
WTI remains bid around $43.00, up 0.46% on a day, while heading into the European session on Friday. The energy benchmark portrayed a bearish candlestick the previous day but buyers fail to relinquish the controls.
However, a sustained trading below a falling trend line from August 05 joins the downbeat candlestick formation and the quote’s repeated failures to stay strong beyond $43.00 to favor the sellers.
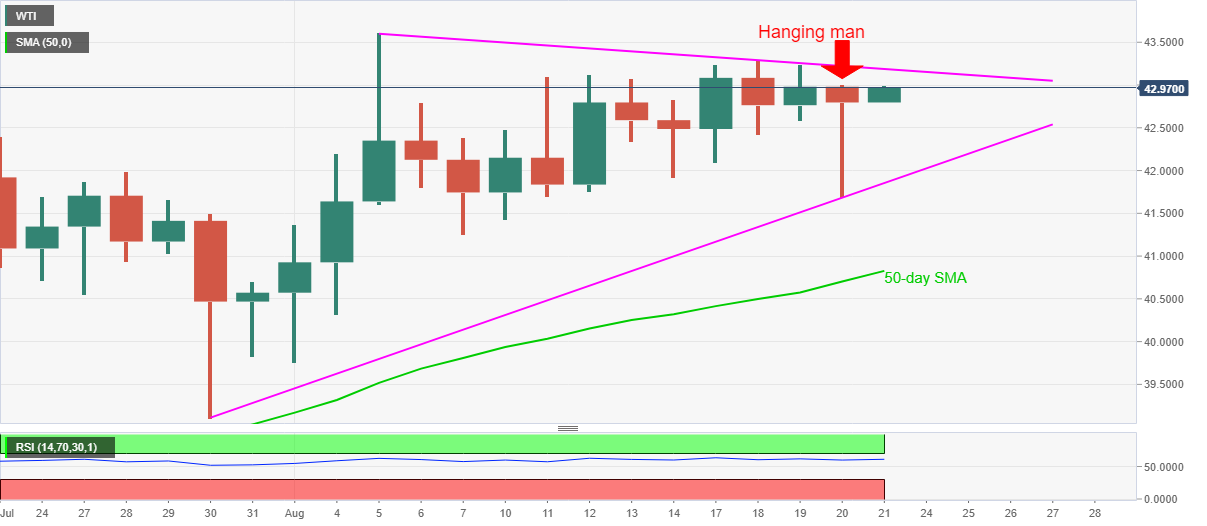
Hence, the quote’s declines below $42.30 and an ascending trend line from July 30, at $41.85, become expected. Though, any more weakness by the oil prices below $41.85 will challenge a 50-day SMA level of $40.82.
Meanwhile, the aforementioned resistance line around $43.20 precedes the monthly high of $43.62 and February month’s low near $44.00 to challenge the bulls.
If at all the black gold manages to rise past-$44.00, March month high near $48.75 will be on the buyers’ radars.
WTI daily chart
Trend: Pullback expected
