Gold prices stay on the back-foot while taking rounds to the intraday low under $1,931, down 0.40% on a day, during the pre-European trading on Monday. In doing so, the yellow metal extends Friday’s bearish momentum amid broadly upbeat market sentiment.
The bullion bears the burden of improvement in risk-tone as well as the US dollar’s rise. Hopes of an early cure to the coronavirus (COVID-19), as teased by US President Donald Trump, favored S&P 500 Futures to mark the record high near 3,400. The US dollar index (DXY) also remains on the positive side while taking rounds to 93.25 as we write.
Although no major data/events are up for publishing during this week, Jackson Hole Symposium becomes the key event for traders as odds of economic recovery joins hopes of further stimulus. Meanwhile, the COVID-19 updates have been mostly worrisome as European nations suggest wide wave 2.0, which in turn can take clues from the stimulus deadlock in the US to renew gold’s upside momentum.
Key levels to watch
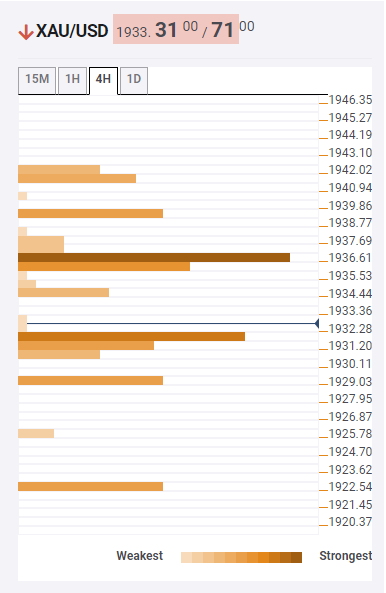
Out own Technical Confluences Indicator portrays the yellow metal’s sluggish moves unless it manages to cross a $1,938 level comprising SMA50 on a 15-minute chart and the previous peak on the hourly formation. Also standing as the immediate resistance could be $1,941 that comprises SMA50 on the hourly play and SMA 10 on the 4-hour chart.
If at all the bulls manage to cross $1,941, Friday’s high near $1,956 and a falling trend line from August 07, near $1,982/83, will be the key.
On the contrary, the previous low on hourly chart and 23.6% Fibonacci retracement of the one-month move near $1,932 can entertain the short-term sellers.
However, a major downside can be expected if the bullion slips below $1,929 including 38.2% Fibonacci retracement on the daily chart.
Overall, the traders should be cautious before taking any major long entries unless the gold prices cross $1,982/83. Alternatively, sellers should wait for a clear break below $1,929 to undertake fresh short positions.
Here is how it looks on the tool
About the Confluence Detector
The TCI (Technical Confluences Indicator) is a tool to locate and point out those price levels where there is a congestion of indicators, moving averages, Fibonacci levels, Pivot Points, etc. Knowing where these congestion points are located is very useful for the trader, and can be used as a basis for different strategies.
Learn more about Technical Confluence
