- Signs of dip demand have emerged on EUR/USD’s daily chart.
- The pair remains trapped in narrow range of 1.1754-1.1883.
EUR/USD carved out a long-tailed Doji candle on Wednesday, signaling dip demand near 1.1770.
The hourly chart shows an upside break of a four-day-long narrowing price or symmetrical triangle. The pattern indicates that the pullback from recent highs above 1.1960 has ended and the bulls have regained control.
A stronger evidence of bull revival would be a move above the high of 1.1883 seen last Friday. That’s because the price action this wee3k has been restricted well within the trading range of 1.1754-1.1883 observed last Friday.
A breakout may be seen on Thursday if Federal Reserve’s chairman Jerome Powell signals tolerance for high inflation during his speech at the annual Jackson Hole Symposium. Above 1.1883, the focus would shaft to the psychological hurdle of 1.20. On the downside, 1.1754 is the level to beat for the sellers.
Daily chart
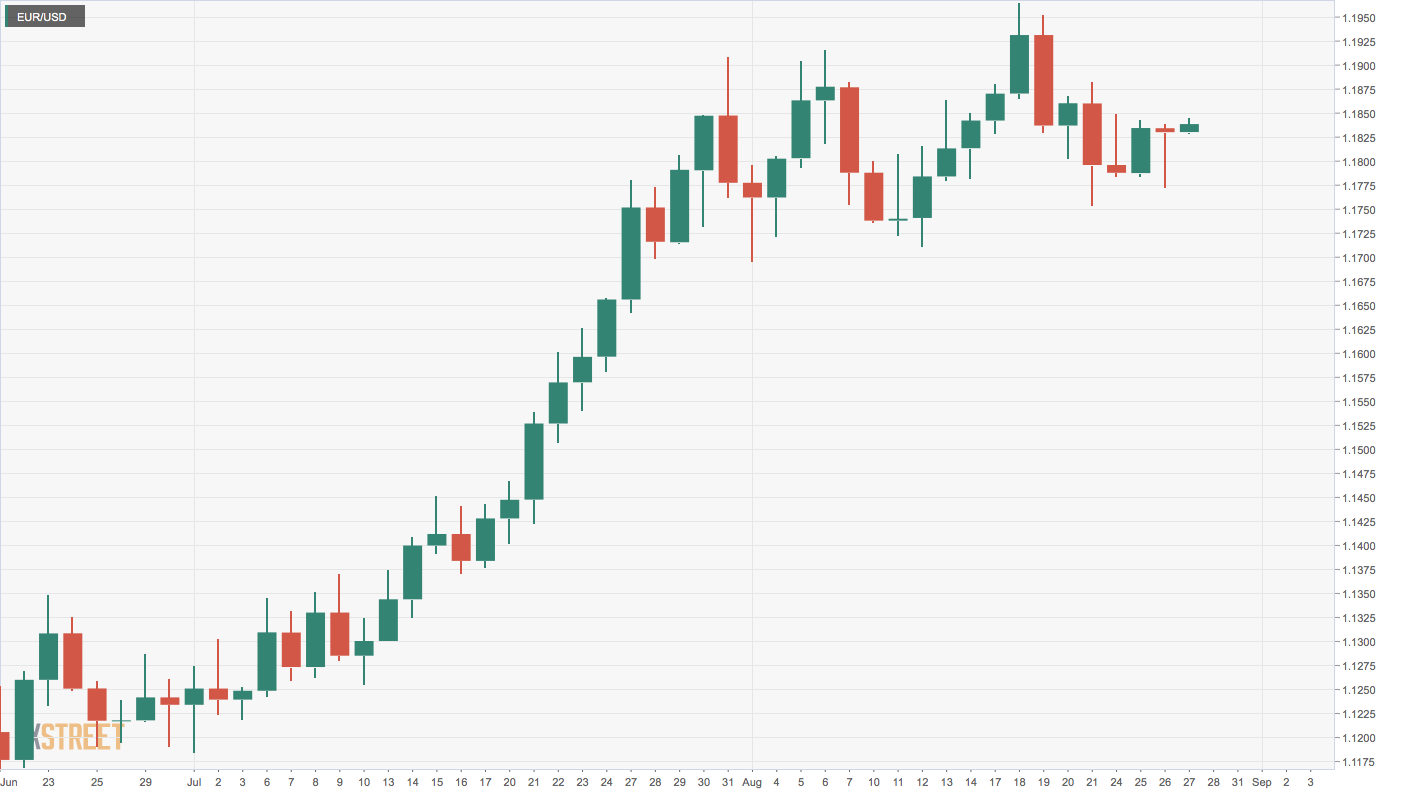
Trend: Bullish
Technical levels
