- USD/CAD trims losses from 1.3086 while also keeping 50-HMA breakout.
- Bullish MACD favors the buyers, the key Fibonacci retracements in the spotlight.
- Sustained trading below 1.3000 will recall the bears.
USD/CAD attempts recovery of late Tuesday’s losses while trading around 1.3065 amid Wednesday’s Asian session. In doing so, the pair keeps the previous day’s break of 50-HMA amid the bullish MACD.
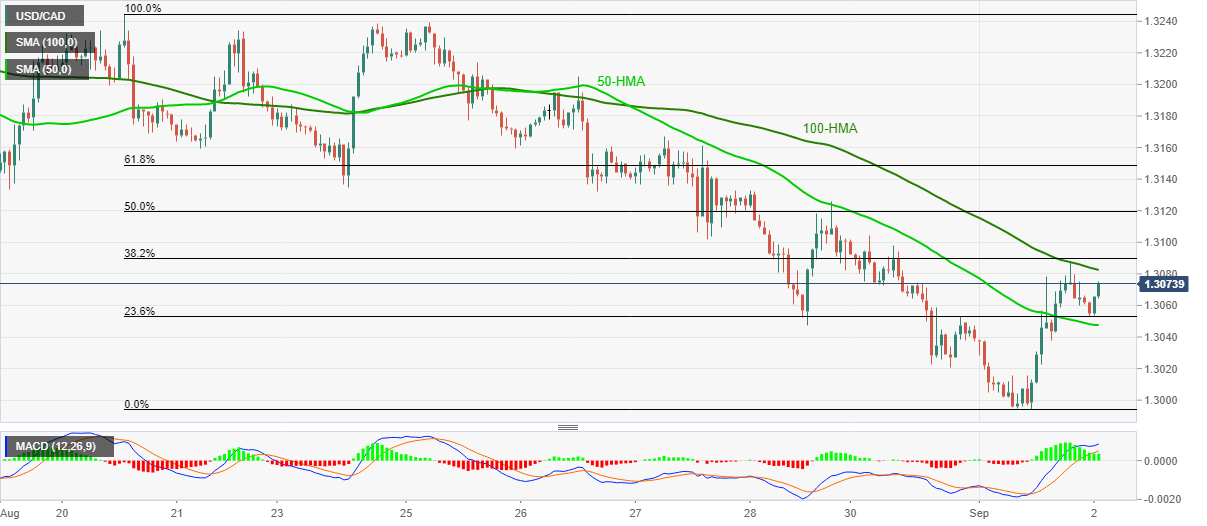
As a result, buyers will again confront the 100-HMA level of 1.3082 to retake controls. However, any further upside will be challenged by 50% and 61.8% Fibonacci retracement levels of the pair’s downside from August 20 to September 01, respectively around 1.3120 and 1.3150.
In a case where the quote manages to stay strong post-1.3150, 1.3200 and multiple resistances around 1.3240/45 marked during the late-August will be the key levels to watch.
Alternatively, the pair’s fresh downside past-50-HMA level of 1.3047 will need validation from a sustained break of 1.3000 round-figures before attacking the year 2019 low of 1.2951.
USD/CAD hourly chart
Trend: Pullback expected
