- USD/CNH’s daily chart indicates the sell-off from May highs has run out of steam.
- Technical indicators suggest scope for a corrective bounce.
USD/CNH is sidelined near 6.83 at press time, having created a Doji candle on Wednesday.
A Doji is usually considered a sign of indecision in the market place. However, in this case, the candlestick has appeared following a notable sell-off from 7.19 to 6.81 and indicates seller exhaustion.
Wednesday’s Doji has also validated oversold readings on the 14-day relative strength index and the stochastic indicator.
As such, the pair could bounce to the 10-day simple moving average (SMA), currently at 6.8690. On the downside, the Sept. 1 low of 6.81 is the level to beat for the bears.
Daily chart
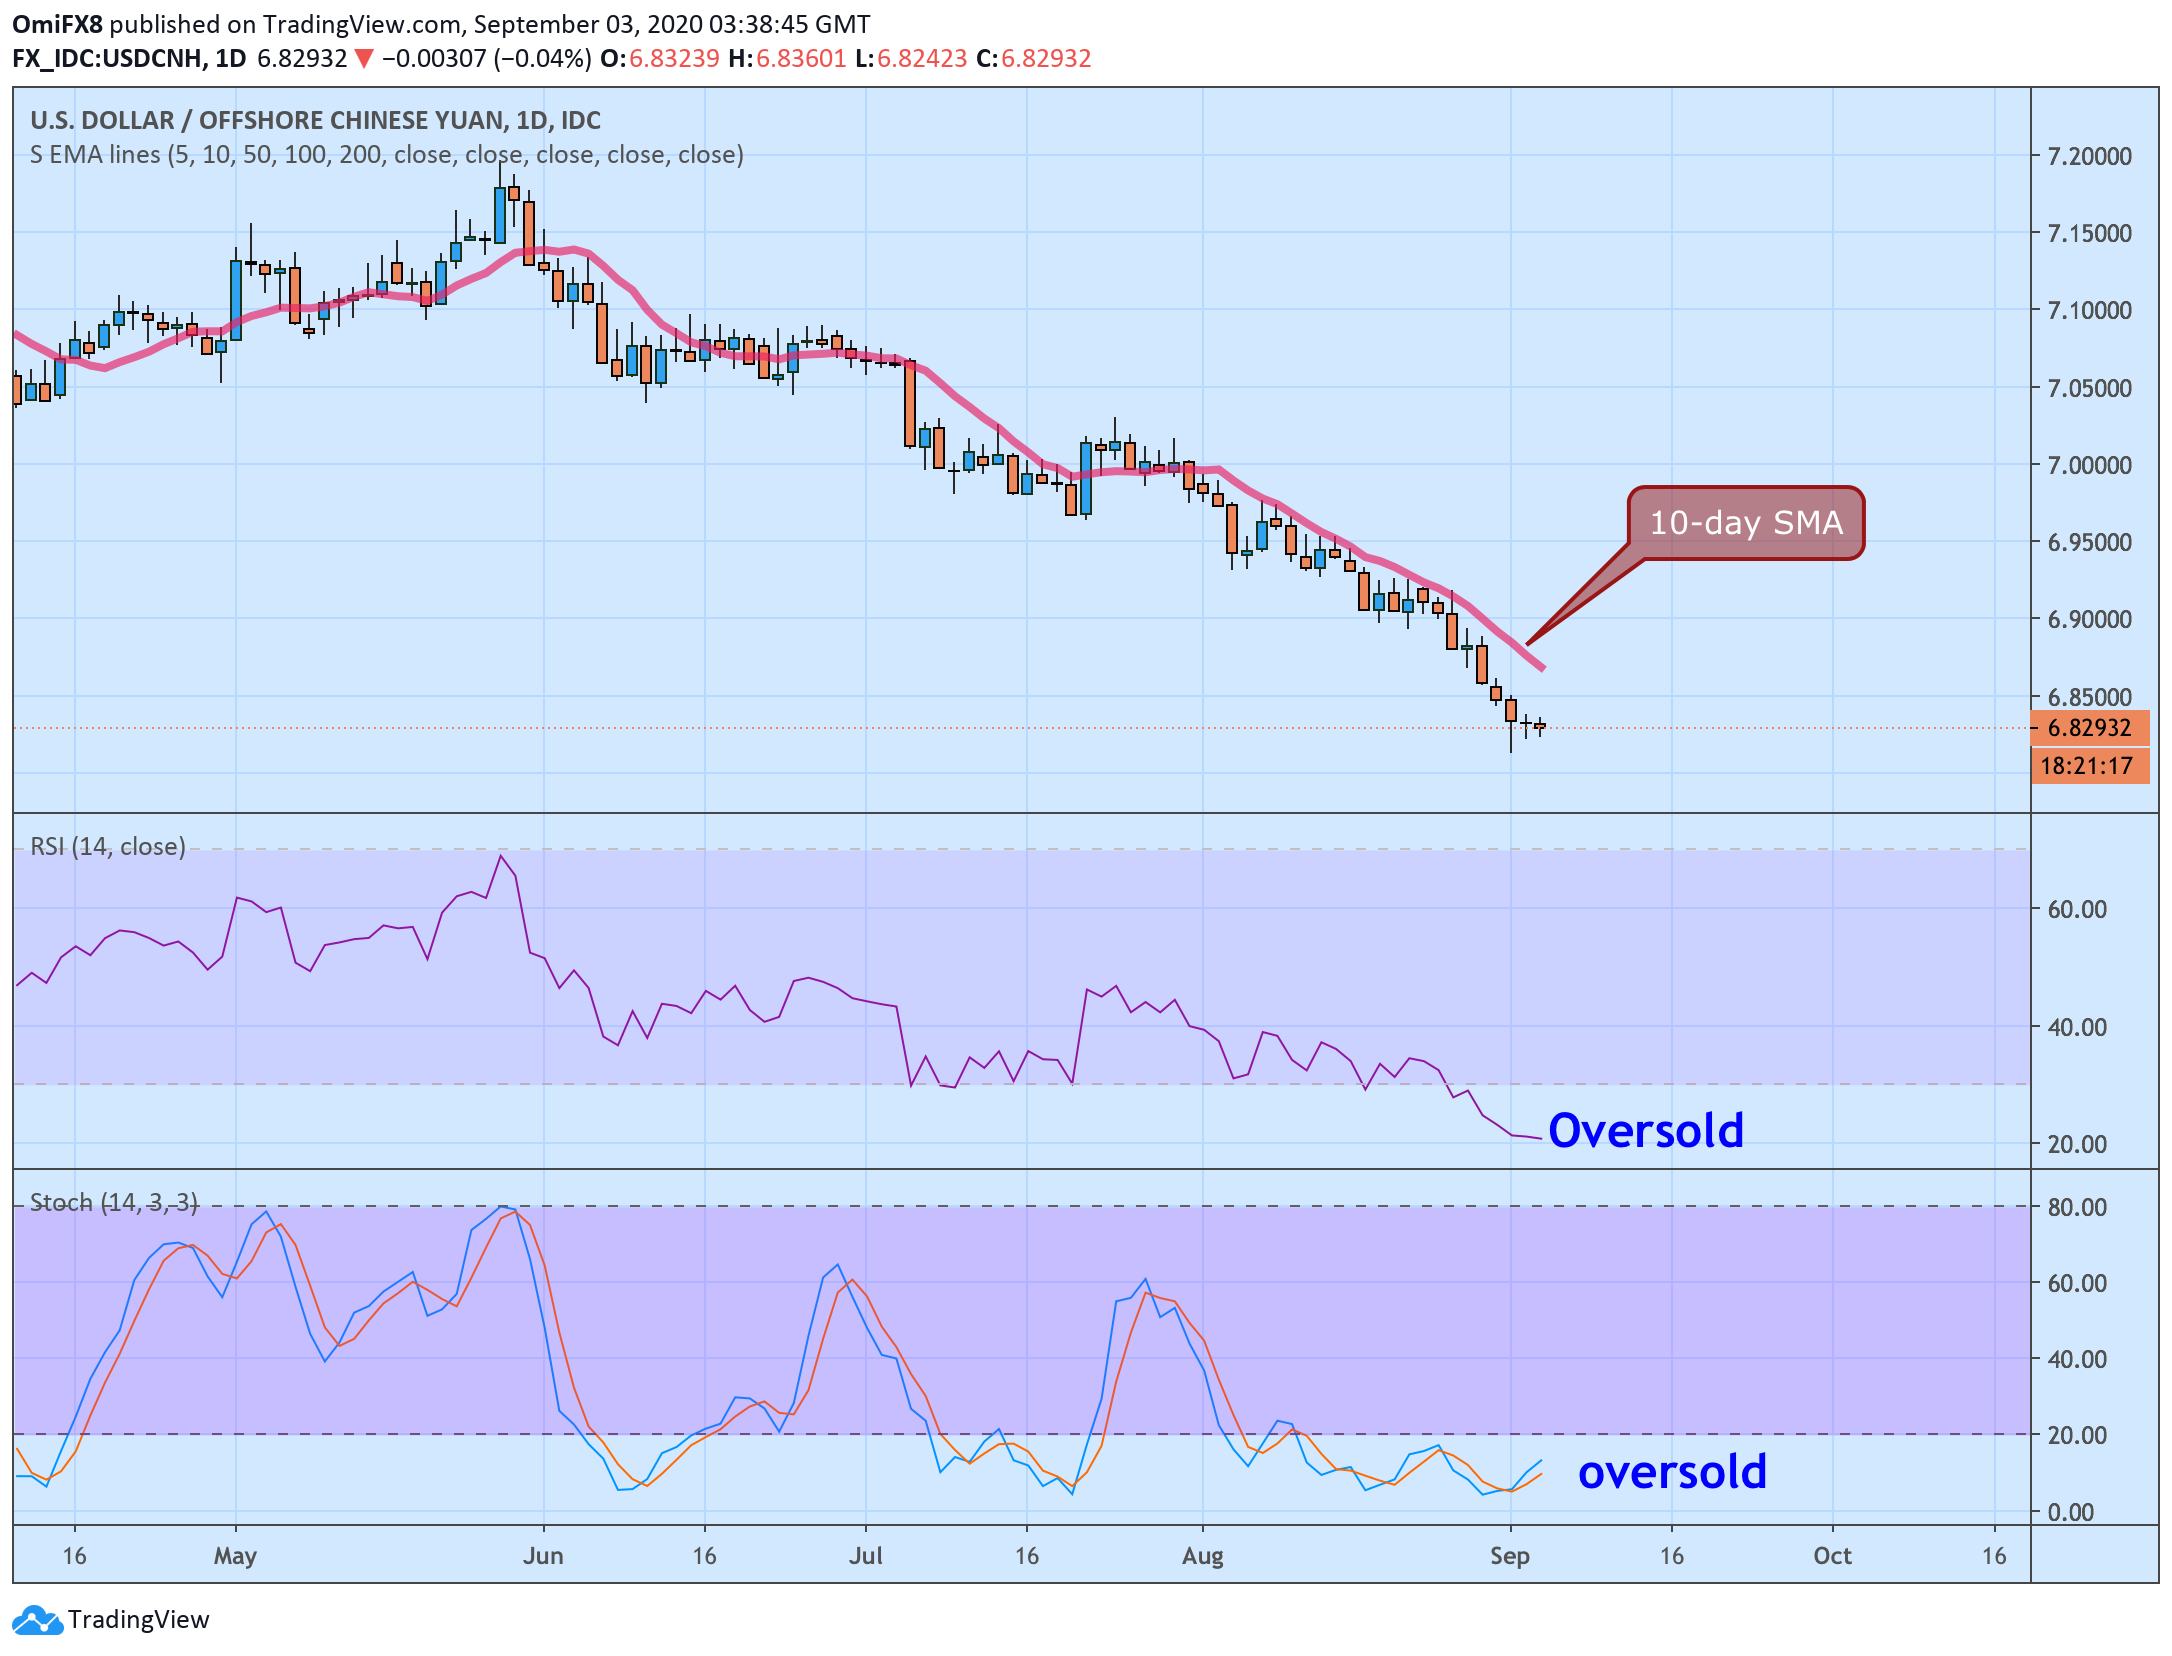
Trend: Bear fatigue
Technical levels
