- Gold extends the previous day’s losses below 100-bar EMA.
- Bearish MACD, downbeat RSI conditions favor the sellers.
- A falling trend line from August 11 adds to the upside filter.
Gold prices remain on the back foot despite the latest pullback from an intraday low of $1,936.22 to $1,940 before Thursday’s European session. The yellow metal’s weakness could be traced from its inability to cross 100-bar EMA and bearish MACD.
The same weakness drags the bullion’s quote towards an ascending trend line from August 12, near $1,924, while the 200-bar EMA level of $1,932.69 may offer an intermediate halt during the fall.
In a case where the metal slips below $1,932, odds of its further weakness towards $1,900 can’t be ruled out.
On the contrary, any upside break beyond the 100-bar EMA level of 1,953.64 may fade around $1,977 whereas a short-term resistance line close to $1,988 and 61.8% Fibonacci retracement of the early-August fall around $1,993 can question the bulls afterward.
It should also be noted that the bull’s dominance past-$1,993 will be probed by the $2,000 threshold before recalling the record high near $2,075.
Gold four-hour chart
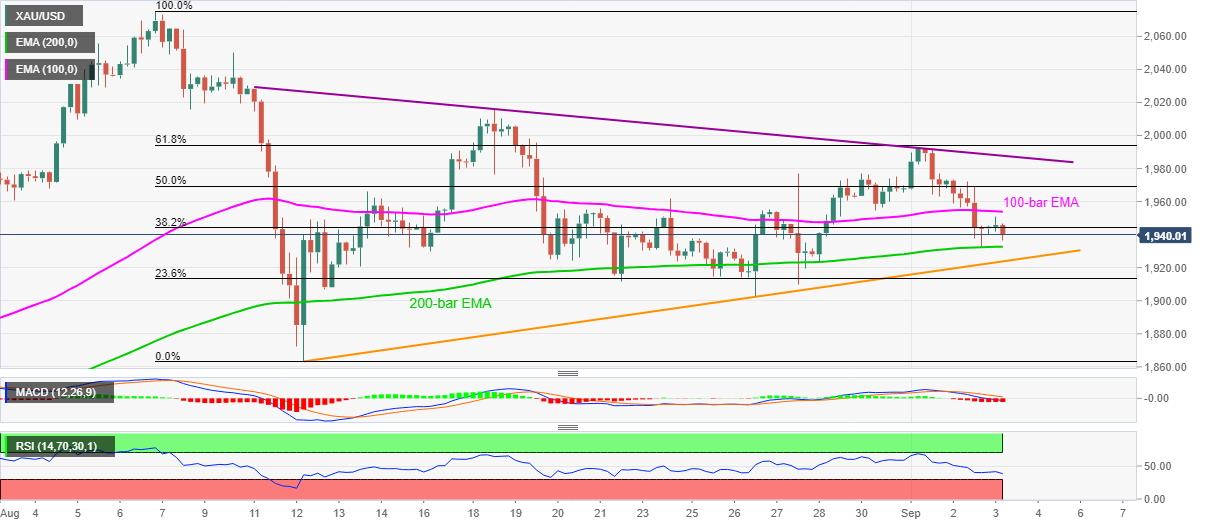
Trend: Further weakness expected
