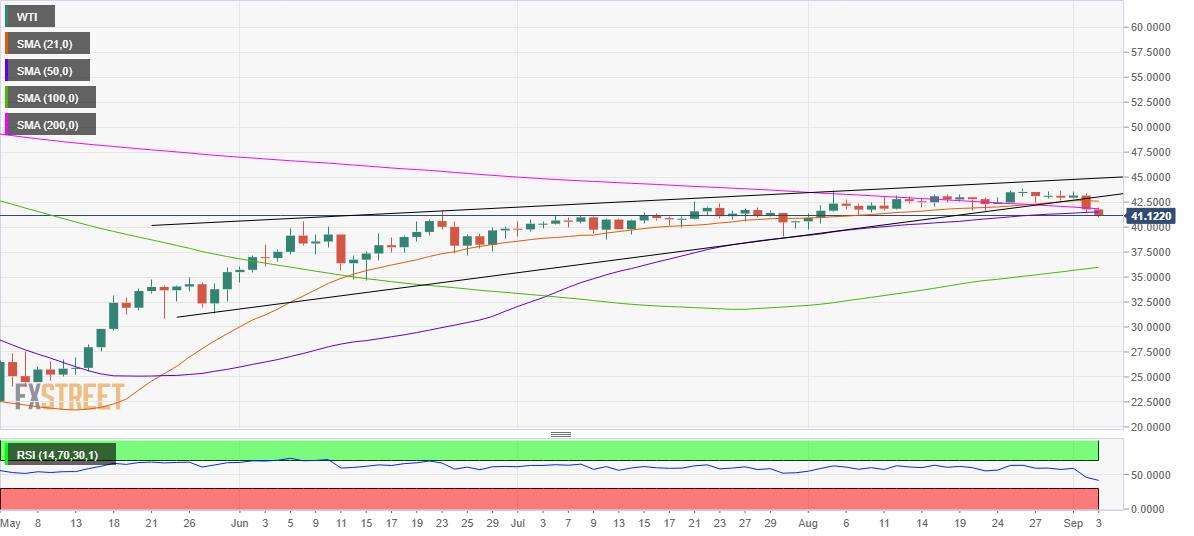
- WTI poised for more declines after breaching the 200-DMA.
- Rising wedge breakdown spotted on the daily chart, with bearish RSI.
- Bears could test the 100-DMA at $36 over the coming quarter.
WTI extends the bearish momentum into a second straight day on Thursday, having lost 3% a day before. At the time of writing, the US oil sheds 1.50%, trading near the lowest levels in four weeks at $40.97.
The recent sell-off in the black gold is mainly chart-based, especially after the price chalked out a rising wedge breakdown on the daily sticks a day before. The WTI barrel closed below the pattern support at $42.85, thus, validating the downside break.
The sell-off gathered pace after the price also closed below the crucial 200-daily Simple Moving Average (DMA), then at $41.91.
The daily Relative Strength Index (RSI) has pierced through the midline and points south, still holding comfortably above the oversold territory, suggesting that the further downside remains on the cards.
The next major support awaits at $40, the round figure, below which the August 3 low of $39.75 could be tested.
In the coming quarter, the price remains poised to test the fierce support of the 100-DMA at $36.
Alternatively, the immediate resistance is seen at $40.51, the previous support now turned upside barrier of 50-DMA.
Acceptance above the latter, the 200-DMA will be retested, now at $41.83.
However, any recovery attempt will likely remain short-lived, as the price is on the verge of forming a death cross (a bearish pattern), where the 200-DMA pierces the 50-DMA from above.
WTI: Daily chart