- Silver takes a U-turn from intraday high of $26.73.
- Bearish candlestick formation, sustained trading below 21-day SMA favor sellers.
- Bulls need to refresh the monthly high before targeting the $30.00 threshold.
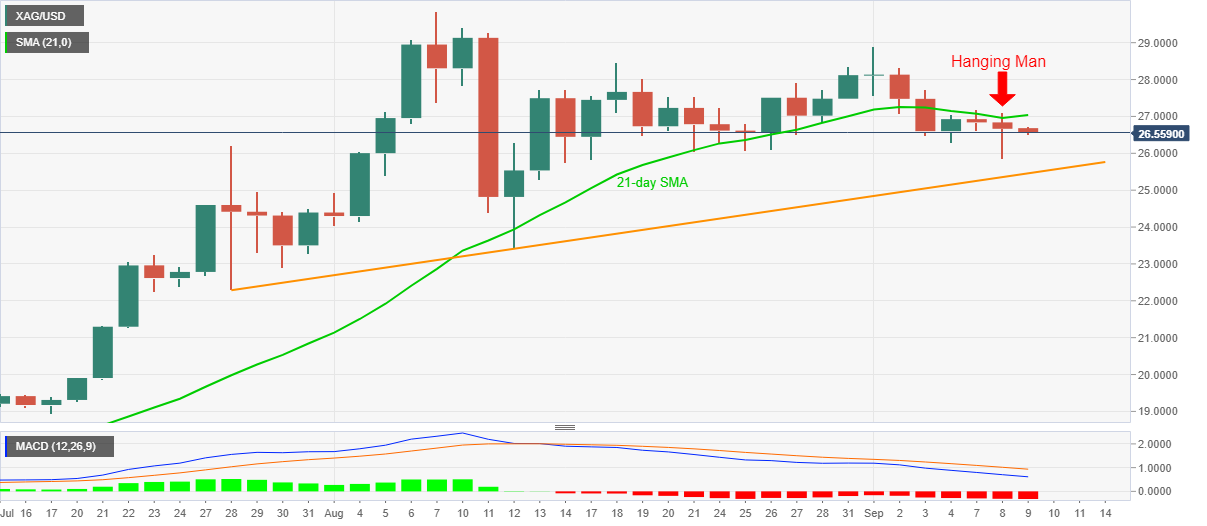
Silver remains on the back foot around $26.54, down 0.45% on a day, during the initial hour of Tokyo open on Wednesday. The white metal flashed “hanging man”, a bearish candlestick formation, on Tuesday’s daily chart while maintaining its trading below 21-day SMA.
Also suggesting the bullion’s weakness could be the MACD signals that suggest the only direction is the south.
As a result, an ascending trend line from July 28, at $25.45 now, gains market attention. However, the $25.85/80 area including the latest low and the bottoms marked during mid-August can offer immediate rest to the quote.
Alternatively, a daily close beyond the 21-day SMA level of $27.04 will aim for $27.50 but may struggle to rise further as the tops marked in the current month and in August, respectively around $28.90 and $29.85, will challenge the bulls targeting $30.00.
Silver daily chart
Trend: Bearish
