- EUR/USD’s weekly chart candlestick pattern shows uptrend fatigue.
- The previous week’s low is the level to defend for the bulls.
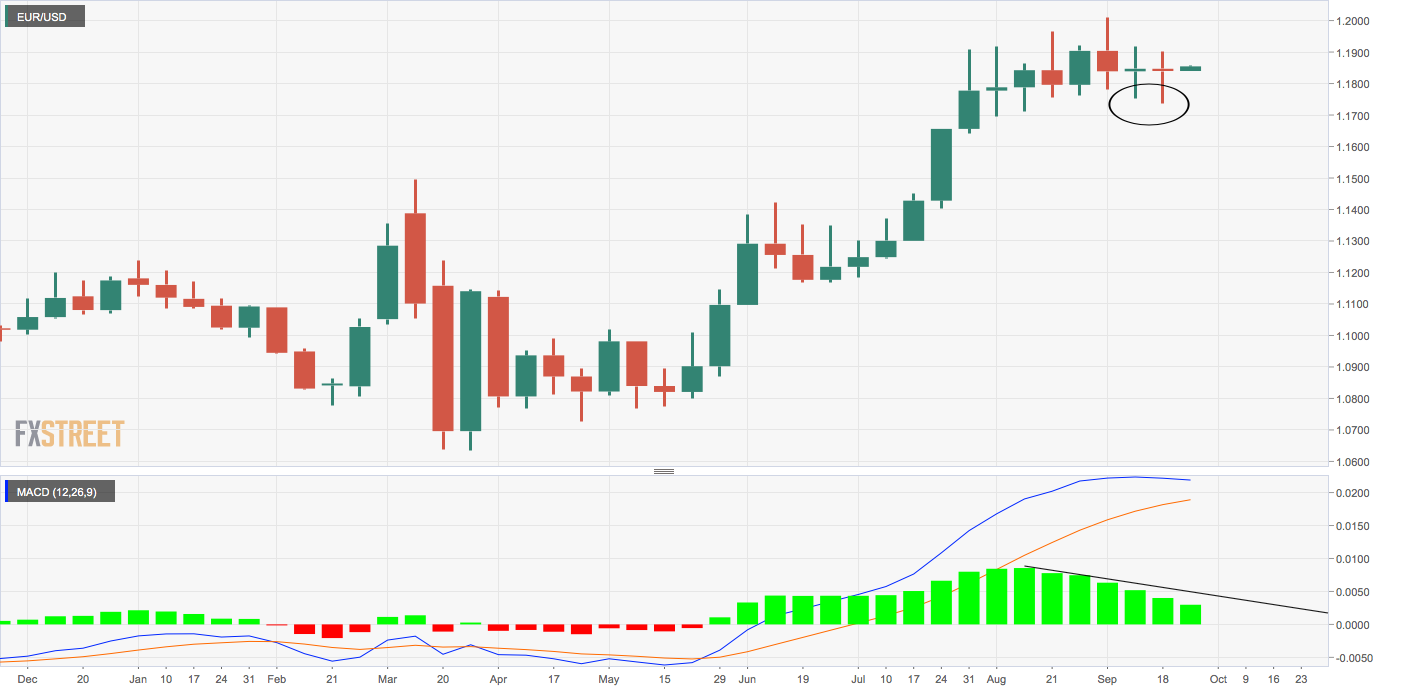
EUR/USD’s two weeks of indecisive price action may presage a short-term bearish reversal.
The pair formed a second consecutive Doji candle on the weekly chart during the five days to Sept. 18. A Doji is usually taken to represent indecision in the market place. However, in this case, the back-to-back Doji candles have appeared following a notable rally from 1.08 to 1.2011. As such, they are indicative of buyer exhaustion.
The lower highs on the weekly chart MACD histogram also suggest bull fatigue. Hence, a pullback may be seen in the short-term.
Acceptance under last week’s low of 1.1737 would confirm a bullish-to-bearish trend change.
On the higher side, a daily close above 1.20 is needed to restore the bullish bias.
Daily chart
Trend: Buyer fatigue
Technical levels
